
Statistics and Probability
Statistics and Probability PDF Notes, Important Questions and Synopsis
SYNOPSIS
Statistics
- Statistics deals with the collection, presentation, analysis and interpretation of data.
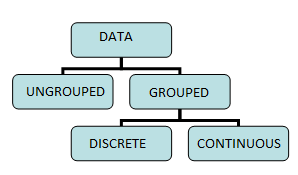
- Data can be either ungrouped or grouped. Further, grouped data can be categorized into
- Discrete frequency distribution
- Continuous frequency distribution
-
Data can be represented in the form of tables or in the form of graphs.
Common graphical forms are bar charts, pie diagrams, histograms, frequency polygons, ogives etc. -
First order of comparison for given data is the measures of central tendencies. Commonly used measures are (i) arithmetic mean, (ii) median and (iii) mode.
- Arithmetic mean or simply mean is the sum of all observations divided by the number of observations. It cannot be determined graphically. Arithmetic mean is not a suitable measure in case of extreme values in the data.
- Median is the measure which divides the data in two equal parts. Median is the middle term when the data is sorted.
In case of odd observations, the middle observation is the median. In case of even observations, the median is the average of the two middle observations.
The median can be determined graphically. It does not take into account all the observations. - The mode is the most frequently occurring observation. For a frequency distribution, the mode may or may not be defined uniquely.
-
Variability or dispersion captures the spread of data. Dispersion helps us to differentiate the data when the measures of central tendency are the same.
The dispersion or scatter of a dataset can be measured from two perspectives:
Taking the order of the observations into consideration, the two measures are- Range
- Quartile deviation
Taking the distance of each observation from the central position yields two measures:
- Mean deviation
- Variance and standard deviation
- Range is the difference between the highest and the lowest observation in the given data.
- There are three quartiles, Q1, Q2 and Q3 which divide the data into 4 equal parts. Here, Q2 is the median of the data.
- Mean of the absolute deviations about ‘a’ gives the ‘mean deviation about a’, where ‘a’ is the mean. It is denoted as MD(a).
Therefore,
MD(a) = Sum of absolute values of deviations from the mean 'a' divided by the number of observations.
Mean deviation can be calculated about the median or mode. - Merits of mean deviation:
- It utilises all the observations of the set.
- It is the least affected by extreme values.
- It is simple to calculate and understand.
- Limitations of mean deviation:
- The foremost weakness of mean deviation is that in its calculations, negative differences are considered positive without any sound reasoning.
- It is not amenable to algebraic treatment.
- It cannot be calculated in the case of open end classes in the frequency distribution.
- Variance: Measure of variation based on taking the squares of the deviation.
- Variance is given by the mean of squared deviations. If the variance is small, then the data points cluster around the mean; otherwise, they are spread across.
- Standard deviation is simply expressed as the positive square root of variance of the given data set. Standard deviation of a set of observations does not change if a non-zero constant is added or subtracted from each observation.
- Merits of standard deviation:
- It is based on all the observations.
- It is suitable for further mathematical treatments.
- It is less affected by the fluctuations of sampling.
- A measure of variability which is independent of the units is called the coefficient of variation. It is denoted as CV.
- Coefficient of variation: A dimensionless constant which helps compare the variability of two observations with same or different units. The distribution having a greater coefficient of variation has more variability around the central value than the distribution having a smaller value of the coefficient of variation.
Probability
- The theory of probability is a branch of mathematics which deals with uncertain or unpredictable events. Probability is a concept which gives a numerical measurement for the likelihood of occurrence of an event.
- The sample space S of an experiment is the set of all its outcomes. Thus, each outcome is also called a sample point of the experiment.
- An experiment is called random experiment if it satisfies the following two conditions:
- It has more than one possible outcome.
- It is not possible to predict the outcome in advance.
- Deterministic experiment: An experiment which results in a unique outcome.
- Sample space is a set consisting of all the outcomes; its cardinality is given by n(S). Any subset ‘E’ of a sample space for an experiment is called an event.
- The empty set and the sample space S describe events. In fact, is called an impossible event and S, i.e. the whole sample space, is called a sure event.
- If an event E has only one sample point of a sample space, it is called a simple (or elementary) event.
- A subset of the sample space which has more than an element is called a compound event.
- Events are said to be equally likely if we have no reason to believe that one is more likely to occur than the other. Both outcomes (head and tail) of tossing a coin are equally likely.
- The complement of an event A is the set of all outcomes which are not in (or not favourable to) A. It is denoted by A’.
- Certain event (sure event): If a random experiment occurs always, then the corresponding event is called a certain event.
- Impossible event: If a random experiment never occurs, then the corresponding event is called an impossible event.
- Mutually exclusive event: In a random experiment, if the occurrence of any one event prevents the occurrence of all the other
- events, then the corresponding events are said to be mutually exclusive.
- In other words, events A and B are said to be mutually exclusive if and only if they have no elements in common.
- Exhaustive event: In a random experiment, if the union of two or more events is the sample space, then the associated events are said to be exhaustive events.
- In other words, when every possible outcome of an experiment is considered, the events are called exhaustive events.
- Probability of an event E is the ratio of the number of elements in the event to the number of elements in the sample space.
i. P(E) = 0 £ P(E) £
ii. 0 £ P(E) £ 1 - Independent events: Two or more events are said to be independent if the occurrence or non-occurrence of any of them does not affect the probability of occurrence or non-occurrence of the other events.The complement of an event A is the set of all outcomes which are not in (or not favourable to) A. It is denoted by A’.
Download complete content for FREE 
JEE Main - Maths
Asked by pankajofficial | 28 Jun, 2024 05:24: PM
JEE Main - Maths
Asked by pankajofficial | 20 Jun, 2024 12:28: AM
JEE Main - Maths
Asked by ms9876tr | 28 Apr, 2024 12:05: PM
JEE Main - Maths
Asked by smeerarajeev | 02 Apr, 2024 09:46: PM
JEE Main - Maths
Asked by anushkarajwar | 24 Mar, 2024 01:19: PM
JEE Main - Maths
Asked by dipeshsharma969 | 10 Jun, 2022 01:31: PM
JEE Main - Maths
Asked by abhijaybhat1 | 29 Apr, 2022 09:16: PM
JEE Main - Maths
Asked by prithviramesh7 | 16 Apr, 2022 03:33: AM
Related Chapters
- Sets, Relations and Functions
- Complex Numbers and Quadratic Equations
- Matrices and Determinants
- Permutations and Combinations
- Mathematical Induction
- Binomial Theorem and its Simple Applications
- Sequences and Series
- Limit, Continuity and Differentiability
- Integral Calculus
- Differential Equations
- Co-ordinate Geometry
- Three Dimensional Geometry
- Vector Algebra
- Trigonometry
- Mathematical Reasoning
