
CBSE Class 9 Physics Velocity Time Graphs


- Time- 0 10 20 30 40 50 Speed- 5 10 15 20 25 30 Find the distance travelled in 50 seconds
- Starting from rest, an object is uniformly accelerated to a speed of 60m/s in 20s. The object travels with this speed for next 40s and is then brought to rest by a uniform retardation in the next 30s.Sketch velocity time graph and calculate the acceleration, retardation and the total distance travelled. Hint: acceleration =rate of change of velocity. distance covered =area under velocity-time graph .
- what is velocity time graph
- What information can you get from velocity time graph of an object’s motion? Write three points at least.
-
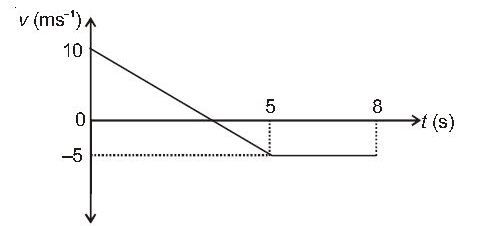
Please solve the given question
- What is accerlated motion??
- A car is moving with a velocity of 7m per second it's velocity decreasing at the rate of 2.5 metre per second s square. What
-
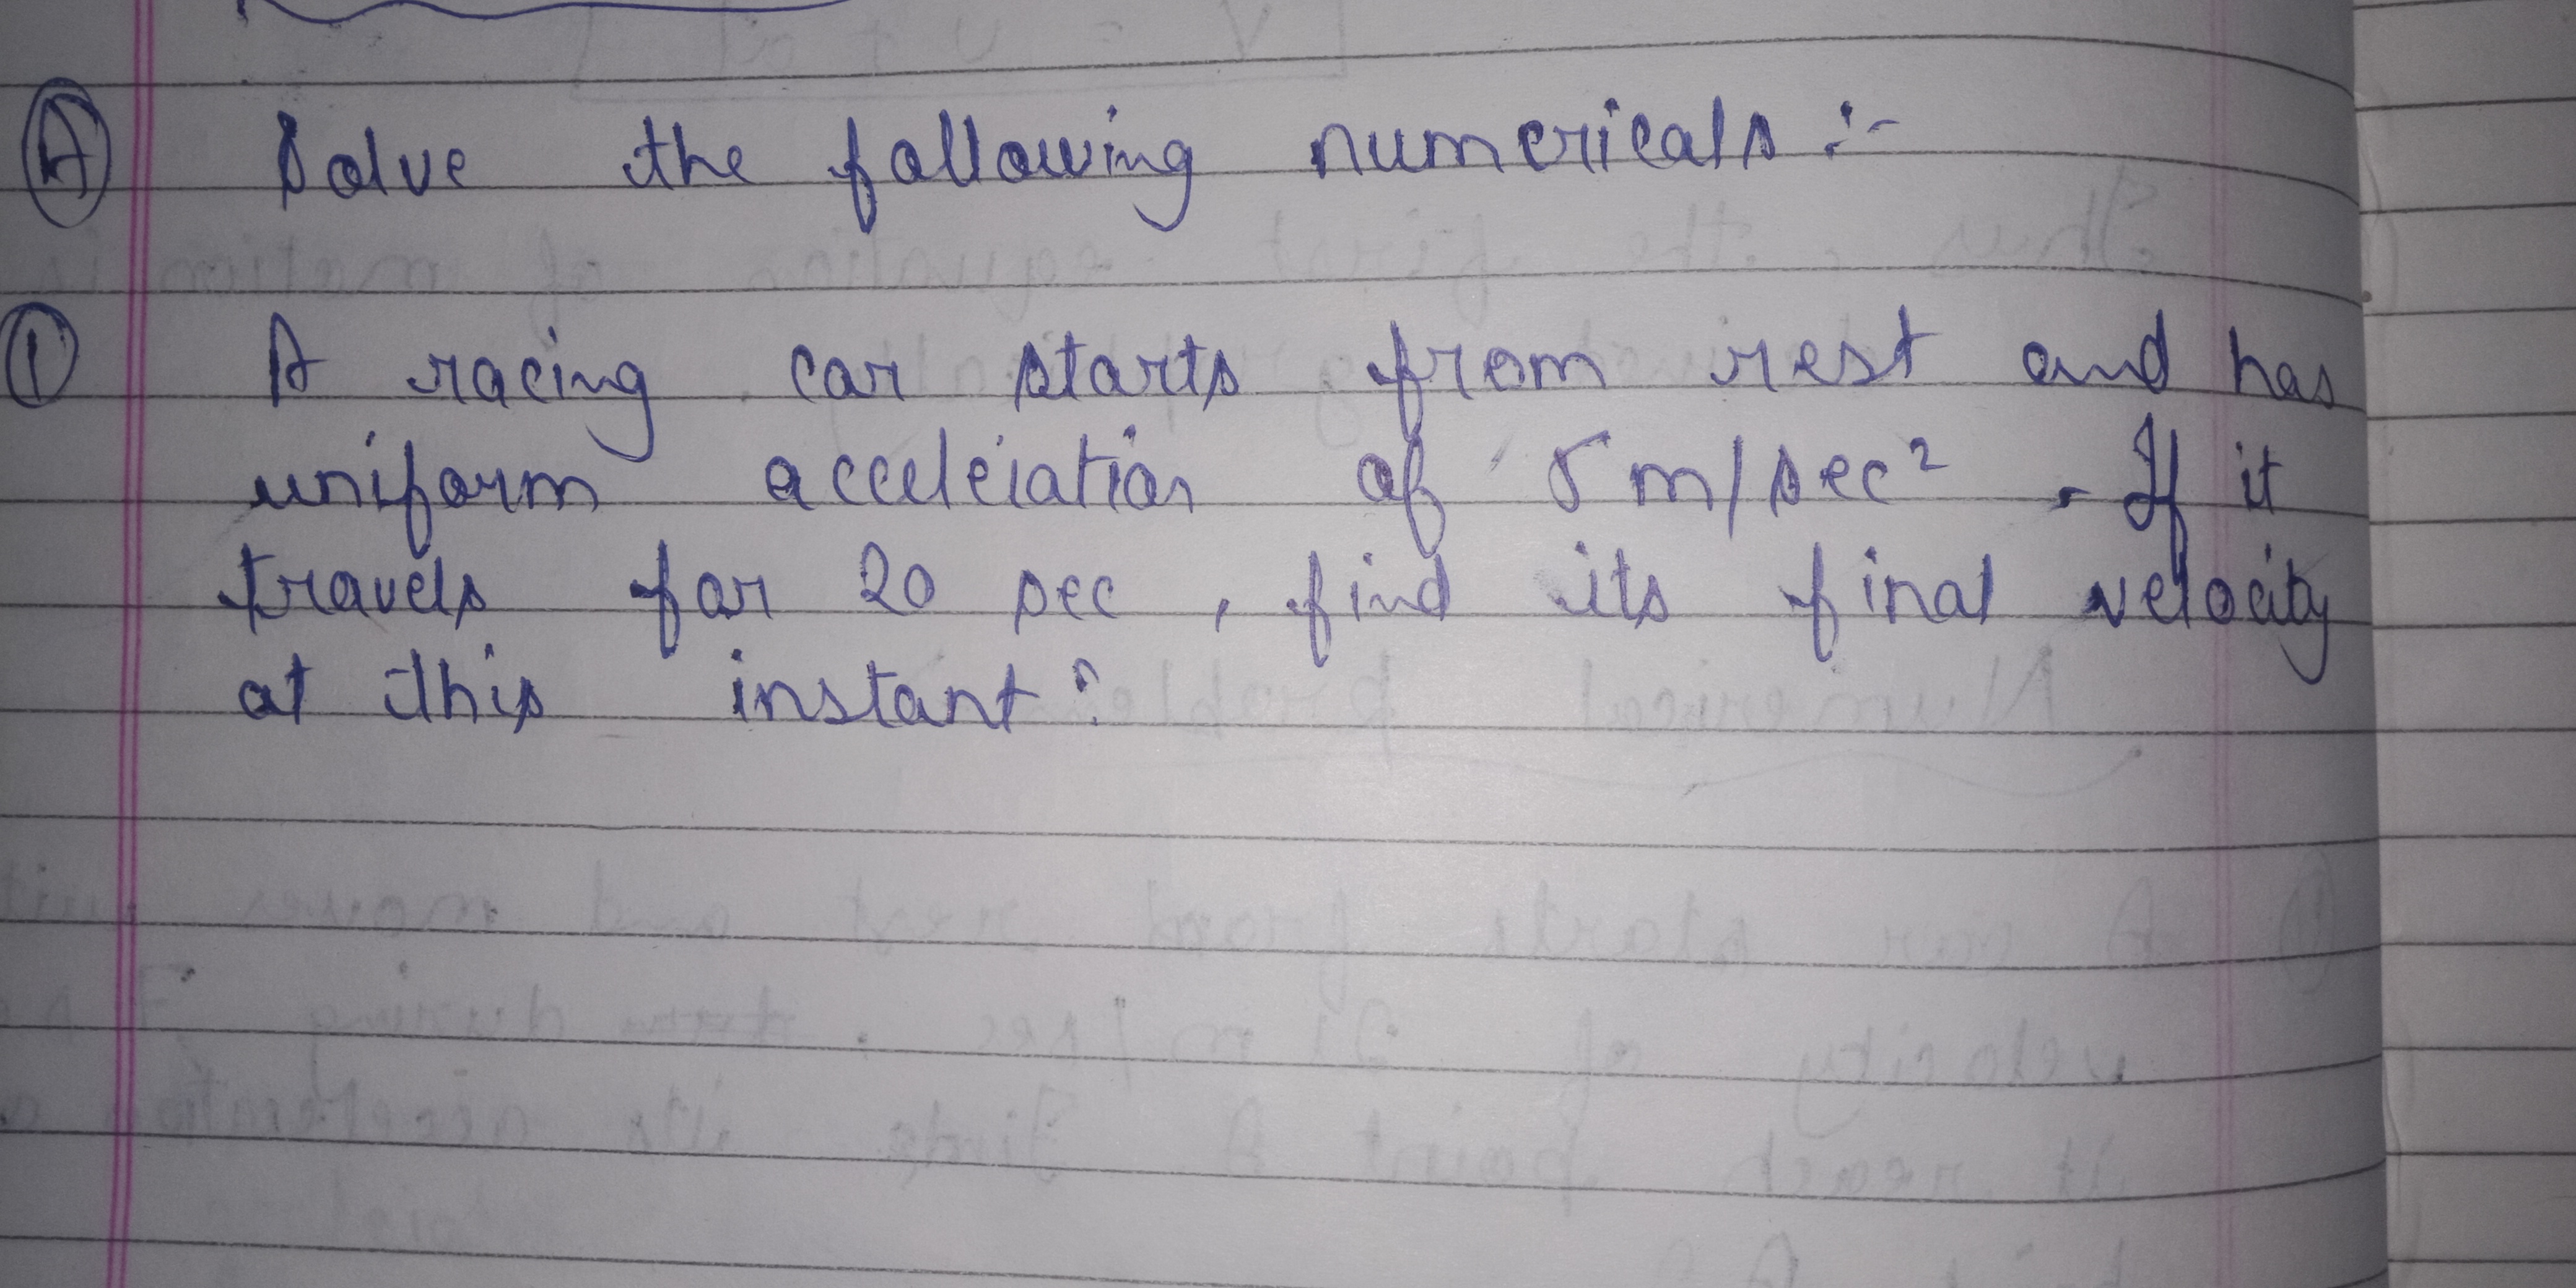
A racing car starts from rest and has uniform acceleiation of 5m/sec ^2.If it travels for 20sec ,find the final velocity at this instant
-
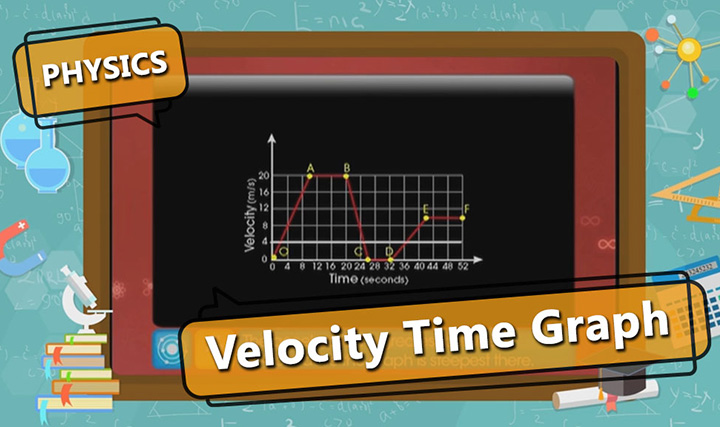
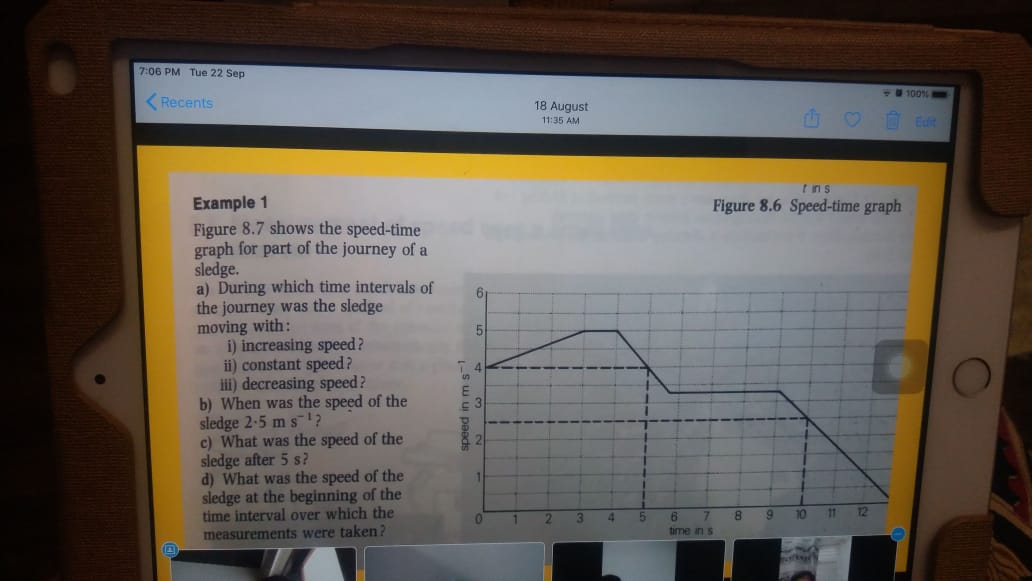
The velocity-time graph (v-t) of a car moving along a
level road is shown below.Find the average speed of the
car in the time interval 0 to 8 s.
- Draw v-t with the data given below and answer the questions below velocity (m/s) 0 10 20 30 20 10 0 time (s) 0 5 10 15 20 25 30 1. Calculate the acceleration during 0 to 15 seconds 2.calculate the acceleration during last 15 seconds 3. Calculate the total distance travelled by the object
