
CBSE Class 9 - Velocity Time Graphs Videos
Interpretation and application of velocity vs time graph
This video explains the case study based question based on Interpretation and application of velocity vs time graph
More videos from this chapter
View All-
Motion
-
Motion
-
Motion

-
Laws of Motion

-
Motion
- Time- 0 10 20 30 40 50 Speed- 5 10 15 20 25 30 Find the distance travelled in 50 seconds
- Starting from rest, an object is uniformly accelerated to a speed of 60m/s in 20s. The object travels with this speed for next 40s and is then brought to rest by a uniform retardation in the next 30s.Sketch velocity time graph and calculate the acceleration, retardation and the total distance travelled. Hint: acceleration =rate of change of velocity. distance covered =area under velocity-time graph .
- what is velocity time graph
- What information can you get from velocity time graph of an object’s motion? Write three points at least.
-
Please solve the given question
- What is accerlated motion??
- A car is moving with a velocity of 7m per second it's velocity decreasing at the rate of 2.5 metre per second s square. What
-
A racing car starts from rest and has uniform acceleiation of 5m/sec ^2.If it travels for 20sec ,find the final velocity at this instant
-
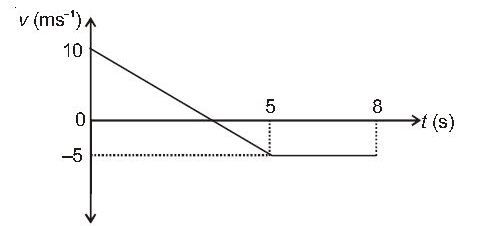
The velocity-time graph (v-t) of a car moving along a
level road is shown below.Find the average speed of the
car in the time interval 0 to 8 s.
- Draw v-t with the data given below and answer the questions below velocity (m/s) 0 10 20 30 20 10 0 time (s) 0 5 10 15 20 25 30 1. Calculate the acceleration during 0 to 15 seconds 2.calculate the acceleration during last 15 seconds 3. Calculate the total distance travelled by the object
