
CBSE Class 11-science Answered
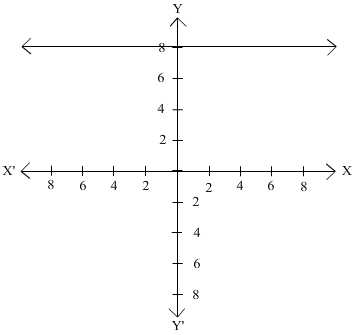
With the help of an example, explain constant function and draw the graph of it.
Asked by Topperlearning User | 04 Jun, 2014, 13:23: PM
The function f : R  R by y = f(x) = c, x
  R where c is a constant and each x R. The graph is a line parallel to x-axis. For example, if f(x) = 8 for each x R, then its graph will be a straight line parallel to x-axis.
Answered by | 04 Jun, 2014, 15:23: PM
Concept Videos
-
Graphs and Algebra of Functions
 Graph of special types of functions. Combine the various functions by defi...
 -
Graph of special types of functions
 Graph of special types of functions. Combine the various functions by defin...
 -
Graphs of special types of functions
 Graph of special types of functions. Combine the various functions by defin...
CBSE 11-science - Maths
Asked by lovemaan5500 | 01 Feb, 2019, 21:42: PM
CBSE 11-science - Maths
Asked by Topperlearning User | 04 Jun, 2014, 13:23: PM
CBSE 11-science - Maths
Asked by Topperlearning User | 04 Jun, 2014, 13:23: PM
CBSE 11-science - Maths
Asked by Topperlearning User | 07 Jun, 2016, 09:43: AM
CBSE 11-science - Maths
Asked by Topperlearning User | 04 Jun, 2014, 13:23: PM
CBSE 11-science - Maths
Asked by Topperlearning User | 04 Jun, 2014, 13:23: PM
CBSE 11-science - Maths
Asked by Topperlearning User | 01 Aug, 2014, 10:44: AM
CBSE 11-science - Maths
 Draw the graph of f(x).
Asked by Topperlearning User | 01 Aug, 2014, 10:55: AM
CBSE 11-science - Maths
Asked by Topperlearning User | 04 Jun, 2014, 13:23: PM
CBSE 11-science - Maths
Asked by Topperlearning User | 04 Jun, 2014, 13:23: PM
