
CBSE Class 11-science Answered
what is v-t graph?
Asked by sush75 | 15 Mar, 2022, 16:02: PM
If velocity is plotted as a function of time so that time is in x-axis and velocity is in y-axis , such a graph is called v-t graph or velocity-time graph.
Slope of a point on the graph gives acceleration at that time .
Answered by Thiyagarajan K | 15 Mar, 2022, 16:10: PM
Concept Videos
-
Motion in a Straight Line

-
Motion in a Straight Line

-
Motion in a Straight Line
CBSE 11-science - Physics
Asked by subhashreeojha235 | 16 Jul, 2023, 19:37: PM
CBSE 11-science - Physics

Asked by sush75 | 15 Mar, 2022, 16:02: PM
CBSE 11-science - Physics
Asked by abhishekchoudhary236 | 11 Nov, 2020, 22:09: PM
CBSE 11-science - Physics
Asked by chera5cibi | 28 Oct, 2020, 05:45: AM
CBSE 11-science - Physics

Asked by pushkarnannu4 | 05 Oct, 2020, 07:17: AM
CBSE 11-science - Physics
Asked by frontech990 | 06 Feb, 2019, 14:21: PM
CBSE 11-science - Physics
Asked by Topperlearning User | 04 Jun, 2014, 13:23: PM
CBSE 11-science - Physics
Asked by Topperlearning User | 04 Jun, 2014, 13:23: PM
CBSE 11-science - Physics
The graph represents the velocity time for the first 4 seconds of motion. Find the distance covered. 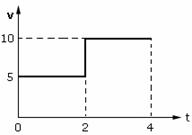
Asked by Topperlearning User | 04 Jun, 2014, 13:23: PM
CBSE 11-science - Physics
Asked by Topperlearning User | 04 Jun, 2014, 13:23: PM
