CBSE Class 10 Answered
Please explain.what is the method to interpret such graphs?
Asked by Divyaa | 13 Oct, 2016, 10:34: PM
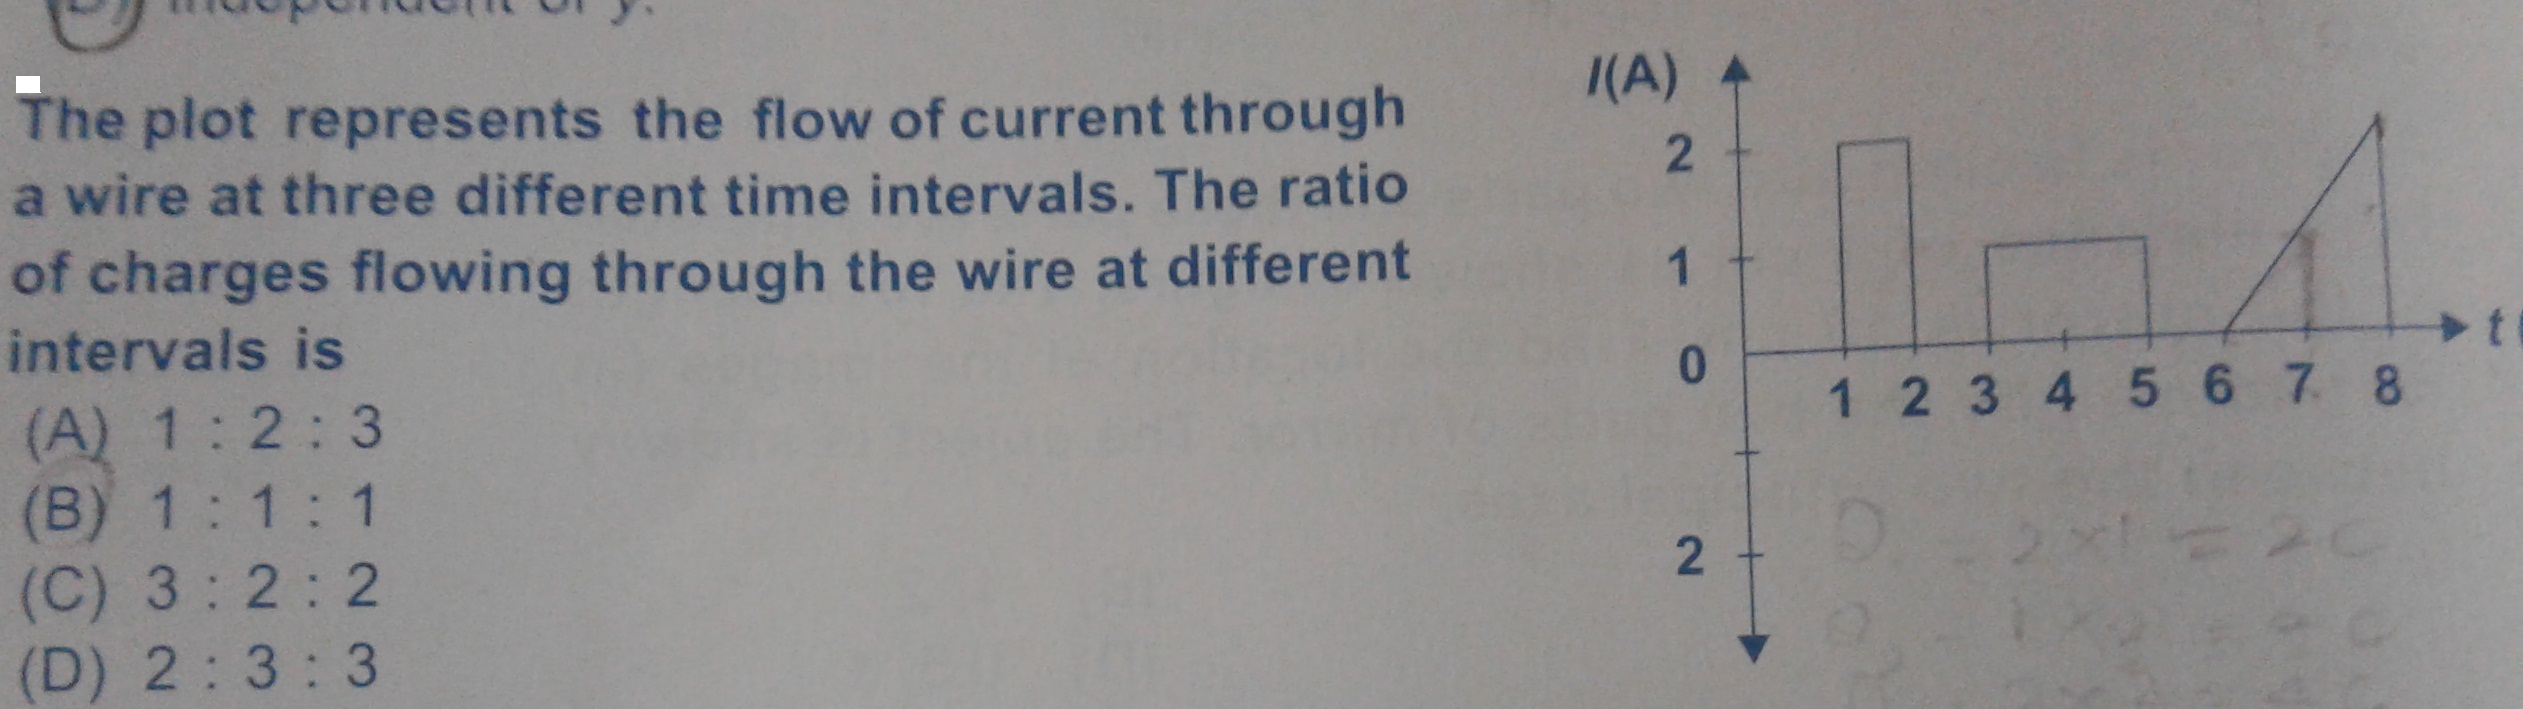
To interpret any graph the first thing to note is the quantity which is to be determined.
In this case charge is to be determined.
The second thing to note is the axes. Here I and t form the y and x-axis, respectively.
Now, see the relation between the given and to be found quantities. In this case Q = It
So, basically we will find charge by multiplying current and time. So, we multiply x and y-axes quantities.
Now, multiplying both axes means finding the area under the graph.
So, the charge in each interval is
Q1 = 2 × (2 - 1) = 2 C
Q2 = 1 × (5 - 3) = 1 × 2 = 2 C
Q3 = ½ b × h = ½ (8 - 6) × 2 = 2 C
Hence, the ratio is 2 : 2 : 2 = 1 : 1 : 1
Answered by Romal Bhansali | 14 Oct, 2016, 09:31: AM
Application Videos
-
Power rating
 This video shows the calculation of electricity consumed, electric current ...
 -
Current and electric potential
This video explains the assertion reason based question based on the con...


CBSE 10 - Physics
Asked by saanviyadla | 24 Jan, 2024, 07:06: PM
CBSE 10 - Physics
Asked by ruparus | 03 Nov, 2022, 10:02: PM
CBSE 10 - Physics
Asked by ksheluka41 | 03 Nov, 2022, 05:33: PM
CBSE 10 - Physics
Asked by ragavarshinik07 | 30 Mar, 2022, 07:17: PM
CBSE 10 - Physics
Asked by suneethasri83 | 01 Jan, 2022, 02:59: PM
CBSE 10 - Physics
Asked by shashankkatekar | 28 Dec, 2021, 07:26: PM
CBSE 10 - Physics
Asked by sunilgupta9419158173 | 20 Jul, 2021, 01:14: PM
CBSE 10 - Physics
Asked by swatipuspapatel | 08 Jul, 2021, 04:36: PM