
CBSE Class 7 - Double Bar Graphs Videos
Double bar graphs
Meaning of double bar graphs, analysing double bar graphs, drawing double bar graphs
More videos from this chapter
View All-
Introduction to Probability

-
Arithmetic Mean
-
Collection and classification of data

-
Organising and Representing data
-
Double bar graphs

- what is a double bar graph
- Can you explain bar graphs
-
bar graph
-
bar graph
- Given data shows performance of two unit tests. English Hindi Maths Science S.Science Term I 70 60 87 60 60 Term II 78 77 60 70 60 Show the data in a double bar graph.
-
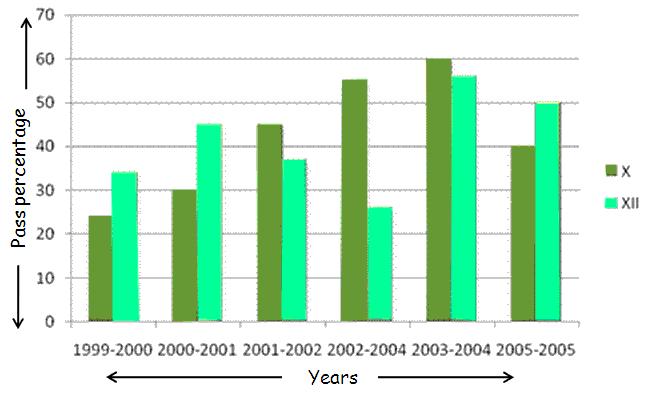 Use the bar graph above to answer the following questions: (a) What information is given by horizontal axis? (b) What information is given by vertical axis? (c) In which year did class xth students performed maximum?
-
The bar graph given below shows the sales of books (in thousands) from six branches of a publishing company during two consecutive years 2000 and 2001.
 (1) What is the ratio of the total sales of branch B2 for both years to the total sales of branch B4 for both years? (2) What is the average sales of all the branches (in thousand numbers) for the year 2000? (3) Total sales of branch B6 for both the years is what percent of the total sales of branches B3 for both the years?
- The birth weight of several babies was recorded as shown in the table below. Construct a bar graph to visually display this data. Baby Weight (lbs) Charlie 6.9 Dennis 8.1 Joan 7.9 Lori 6.2 Matthew 9.4 Sarah 10.5
- Construct the bar graph for the following data that is the monthly expenditures of John's family on different items. Items Expenditure (In Rs.) House Rent 3500 Food 5000 Education 600 Electricity 250 Transport 500 Miscellaneous 400
- The number of trees planted by an agency in different years is given below : Years 1997 1998 1999 2000 2001 2002 Number of trees planted 400 450 700 750 900 1500 Draw a bar graph.
