
CBSE Class 7 Answered
The bar graph given below shows the sales of books (in thousands) from six branches of a publishing company during two consecutive years 2000 and 2001. 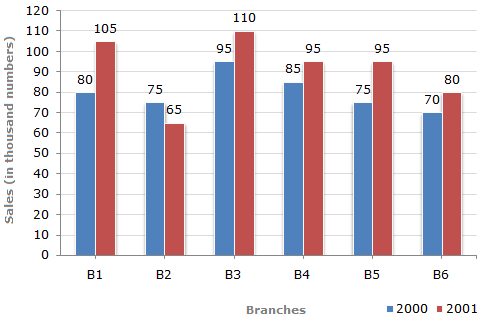 (1) What is the ratio of the total sales of branch B2 for both years to the total sales of branch B4 for both years? (2) What is the average sales of all the branches (in thousand numbers) for the year 2000? (3) Total sales of branch B6 for both the years is what percent of the total sales of branches B3 for both the years?
(1) What is the ratio of the total sales of branch B2 for both years to the total sales of branch B4 for both years? (2) What is the average sales of all the branches (in thousand numbers) for the year 2000? (3) Total sales of branch B6 for both the years is what percent of the total sales of branches B3 for both the years?
Asked by Topperlearning User | 04 Jun, 2014, 01:23: PM
(1) Sales of branch B2 for both years = 75 + 65 = 140
Sales of branch B4 for both years = 85 + 95 = 180
Required ratio =
(2) ) Average sales of all the six branches (in thousand numbers) for the year 2000

(3) Total sales of branch B6 for both the years = 70 + 80 = 150
Total sales of branch B3 for both the years = 95 + 110 = 205
Required percentage =
Sales of branch B4 for both years = 85 + 95 = 180
Required ratio =
(2) ) Average sales of all the six branches (in thousand numbers) for the year 2000
(3) Total sales of branch B6 for both the years = 70 + 80 = 150
Total sales of branch B3 for both the years = 95 + 110 = 205
Required percentage =
Answered by | 04 Jun, 2014, 03:23: PM
Concept Videos

CBSE 7 - Maths
Asked by sarla.singh1977 | 06 Aug, 2021, 08:21: PM
CBSE 7 - Maths
Asked by jeraldrudy | 19 Jul, 2020, 01:57: PM
CBSE 7 - Maths
Asked by Topperlearning User | 13 Oct, 2014, 04:20: PM
CBSE 7 - Maths
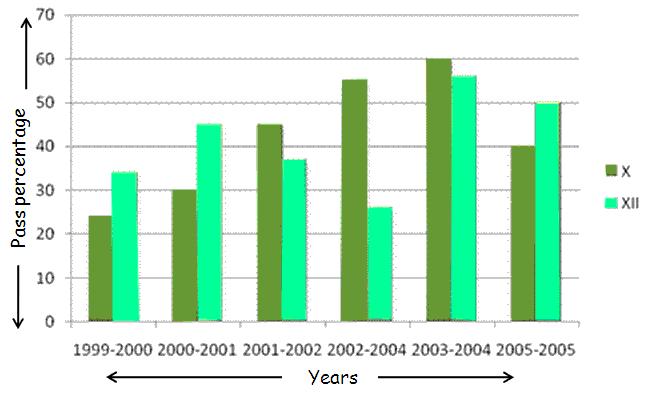 Use the bar graph above to answer the following questions: (a) What information is given by horizontal axis? (b) What information is given by vertical axis? (c) In which year did class xth students performed maximum?
Asked by Topperlearning User | 10 Nov, 2013, 04:08: AM
CBSE 7 - Maths
Asked by Topperlearning User | 04 Jun, 2014, 01:23: PM
CBSE 7 - Maths
Asked by Topperlearning User | 13 Oct, 2014, 04:14: PM
CBSE 7 - Maths
Asked by Topperlearning User | 21 May, 2015, 07:22: AM
CBSE 7 - Maths
Asked by Topperlearning User | 10 Jul, 2014, 12:33: PM
