
CBSE Class 7 Answered
The number of trees planted by an agency in different years is given below :
Years
1997
1998
1999
2000
2001
2002
Number of trees planted
400
450
700
750
900
1500
Draw a bar graph.
Asked by Topperlearning User | 10 Jul, 2014, 12:33: PM
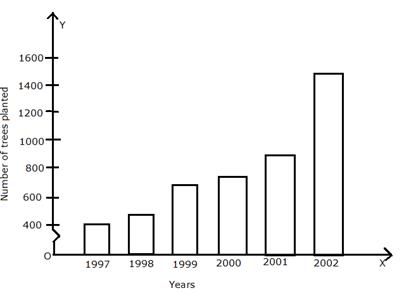
Step 1: We draw two perpendicular lines OX and OY.
Step 2: On OX, we represent years, from 1997-2002 and on OY we represent the number of trees planted.
Step 3: On OY, we start with 400 and marks points at equal intervals of 200.
Step 4: The height of the bars are calculated according to the number of trees.
A kink (~) has been shown on the vertical axis showing that the marking on the vertical axis starts from zero but has been shown to start from 400 as the data needs.
Answered by | 10 Jul, 2014, 02:33: PM
Concept Videos

CBSE 7 - Maths
Asked by sarla.singh1977 | 06 Aug, 2021, 08:21: PM
CBSE 7 - Maths
Asked by jeraldrudy | 19 Jul, 2020, 01:57: PM
CBSE 7 - Maths
Asked by Topperlearning User | 13 Oct, 2014, 04:20: PM
CBSE 7 - Maths
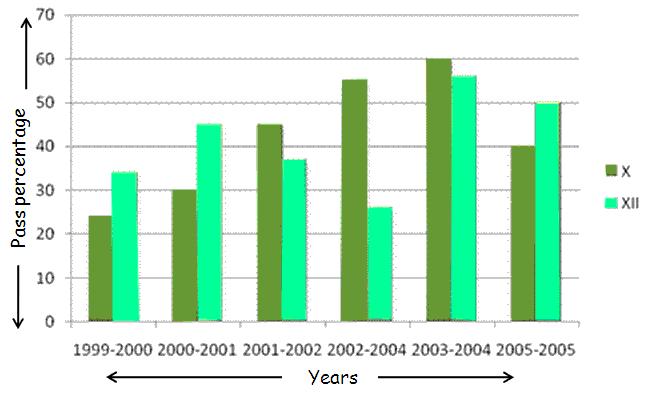 Use the bar graph above to answer the following questions: (a) What information is given by horizontal axis? (b) What information is given by vertical axis? (c) In which year did class xth students performed maximum?
Asked by Topperlearning User | 10 Nov, 2013, 04:08: AM
CBSE 7 - Maths
 (1) What is the ratio of the total sales of branch B2 for both years to the total sales of branch B4 for both years? (2) What is the average sales of all the branches (in thousand numbers) for the year 2000? (3) Total sales of branch B6 for both the years is what percent of the total sales of branches B3 for both the years?
Asked by Topperlearning User | 04 Jun, 2014, 01:23: PM
CBSE 7 - Maths
Asked by Topperlearning User | 13 Oct, 2014, 04:14: PM
CBSE 7 - Maths
Asked by Topperlearning User | 21 May, 2015, 07:22: AM
CBSE 7 - Maths
Asked by Topperlearning User | 10 Jul, 2014, 12:33: PM
