
CBSE Class 7 Answered
The units are weight in lbs. The greatest value is 10.5 and the least value is 6.9
Using graph paper, start with 1 box = 1 unit.
Mark each rectangle along the scale. Label the marks by the units they represent. Then decide how wide each bar should be.
In the graph above, each grid line going from bottom to top represents a multiple of 0.5.
Each small rectangle in the graph below represents 0.5 units. So to draw a vertical bar that represents 6.9 lbs, divide 6.9 by 0.5. Your quotient is a bar height of 13.8 rectangles. Thus the bar for Charlie is 13.8 rectangles in height (and represents 6.9 lbs). To draw a bar that represents 10.5 lbs, divide 10.5 by 0.5. Your quotient is a bar height of 21 rectangles. Thus the bar for Sarah is 21 rectangles in height (and represents 10.5 lbs).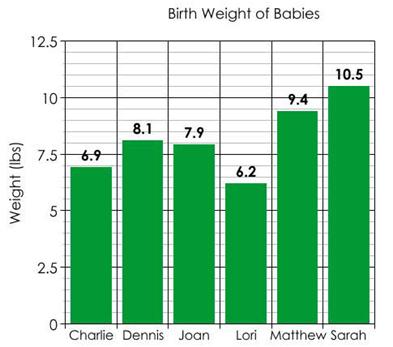
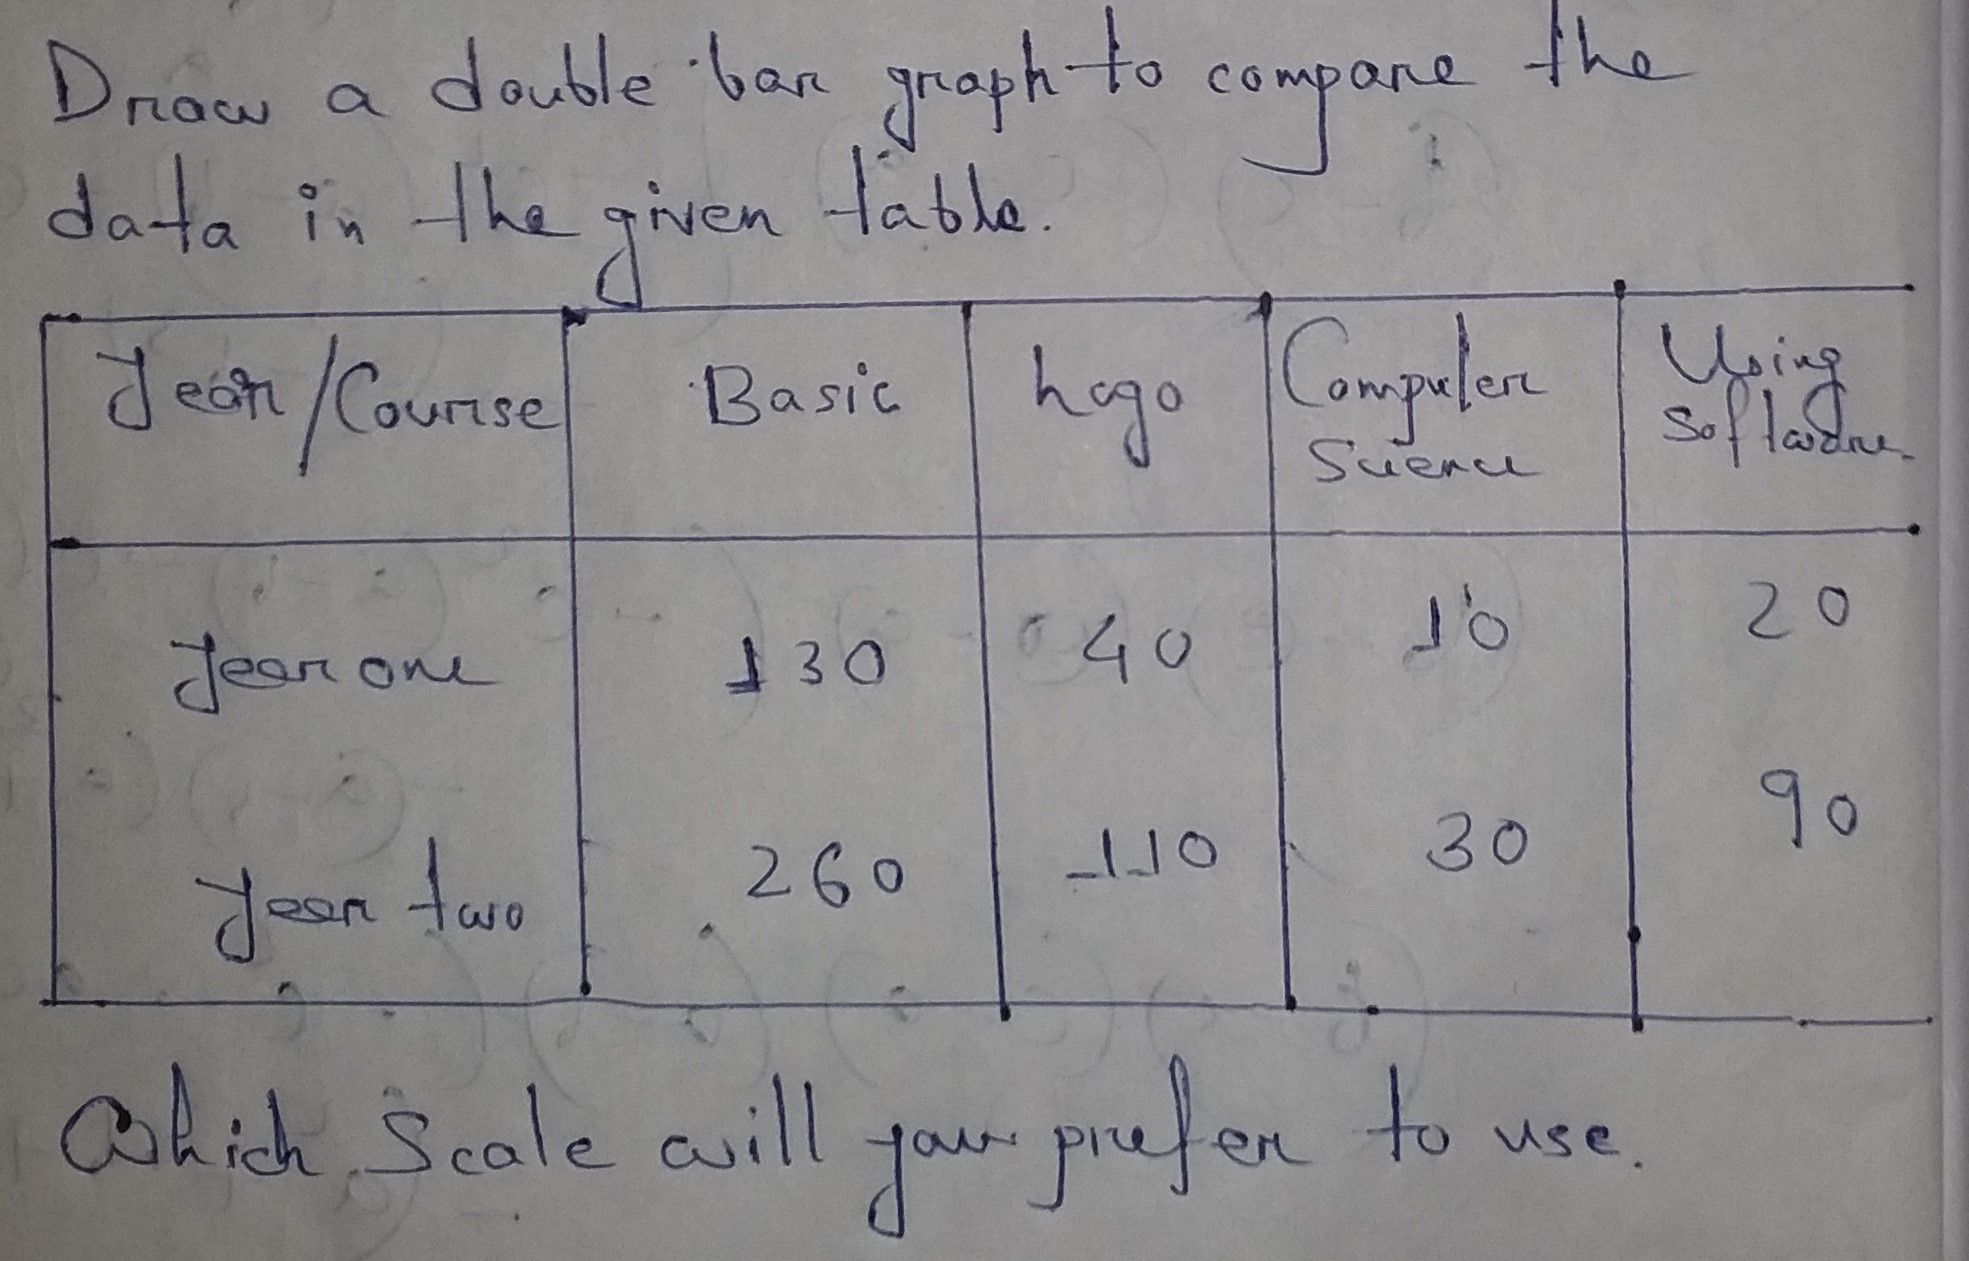
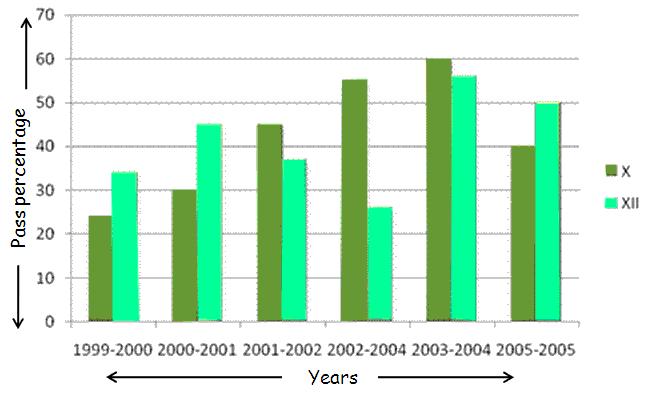 Use the bar graph above to answer the following questions: (a) What information is given by horizontal axis? (b) What information is given by vertical axis? (c) In which year did class xth students performed maximum?
 (1) What is the ratio of the total sales of branch B2 for both years to the total sales of branch B4 for both years? (2) What is the average sales of all the branches (in thousand numbers) for the year 2000? (3) Total sales of branch B6 for both the years is what percent of the total sales of branches B3 for both the years?