
CBSE Class 7 Answered
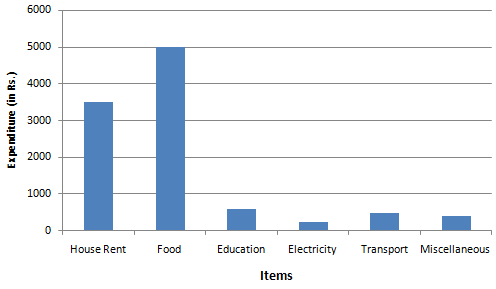
Construct the bar graph for the following data that is the monthly expenditures of John's family on different items.
Items
Expenditure (In Rs.)
House Rent
3500
Food
5000
Education
600
Electricity
250
Transport
500
Miscellaneous
400
Asked by Topperlearning User | 21 May, 2015, 07:22: AM
Step: 1 Initially construct the horizontal line (x-axis) and then construct vertical line (y-axis).
Step: 2 Now mark the labels, in which is items are put on x-axis and the expenditures are placed on the y-axis.
Step: 3 Draw the vertical bar for the corresponding items and its expenditure. Repeat this process until the table value is finish. Now, Construct the bar graph.
Answered by | 21 May, 2015, 09:22: AM
Concept Videos
CBSE 7 - Maths
Asked by sarla.singh1977 | 06 Aug, 2021, 08:21: PM
CBSE 7 - Maths
Asked by jeraldrudy | 19 Jul, 2020, 01:57: PM
CBSE 7 - Maths
Asked by Topperlearning User | 13 Oct, 2014, 04:20: PM
CBSE 7 - Maths
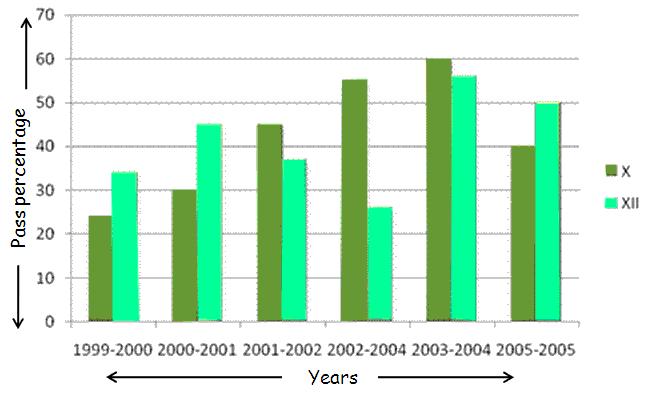 Use the bar graph above to answer the following questions: (a) What information is given by horizontal axis? (b) What information is given by vertical axis? (c) In which year did class xth students performed maximum?
Asked by Topperlearning User | 10 Nov, 2013, 04:08: AM
CBSE 7 - Maths
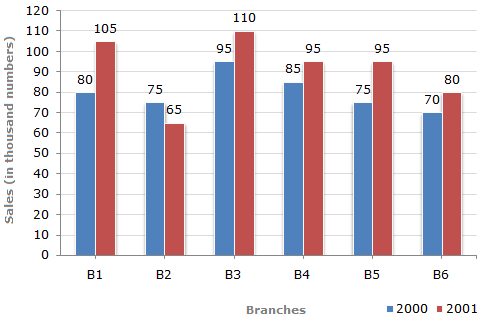 (1) What is the ratio of the total sales of branch B2 for both years to the total sales of branch B4 for both years? (2) What is the average sales of all the branches (in thousand numbers) for the year 2000? (3) Total sales of branch B6 for both the years is what percent of the total sales of branches B3 for both the years?
Asked by Topperlearning User | 04 Jun, 2014, 01:23: PM
CBSE 7 - Maths
Asked by Topperlearning User | 13 Oct, 2014, 04:14: PM
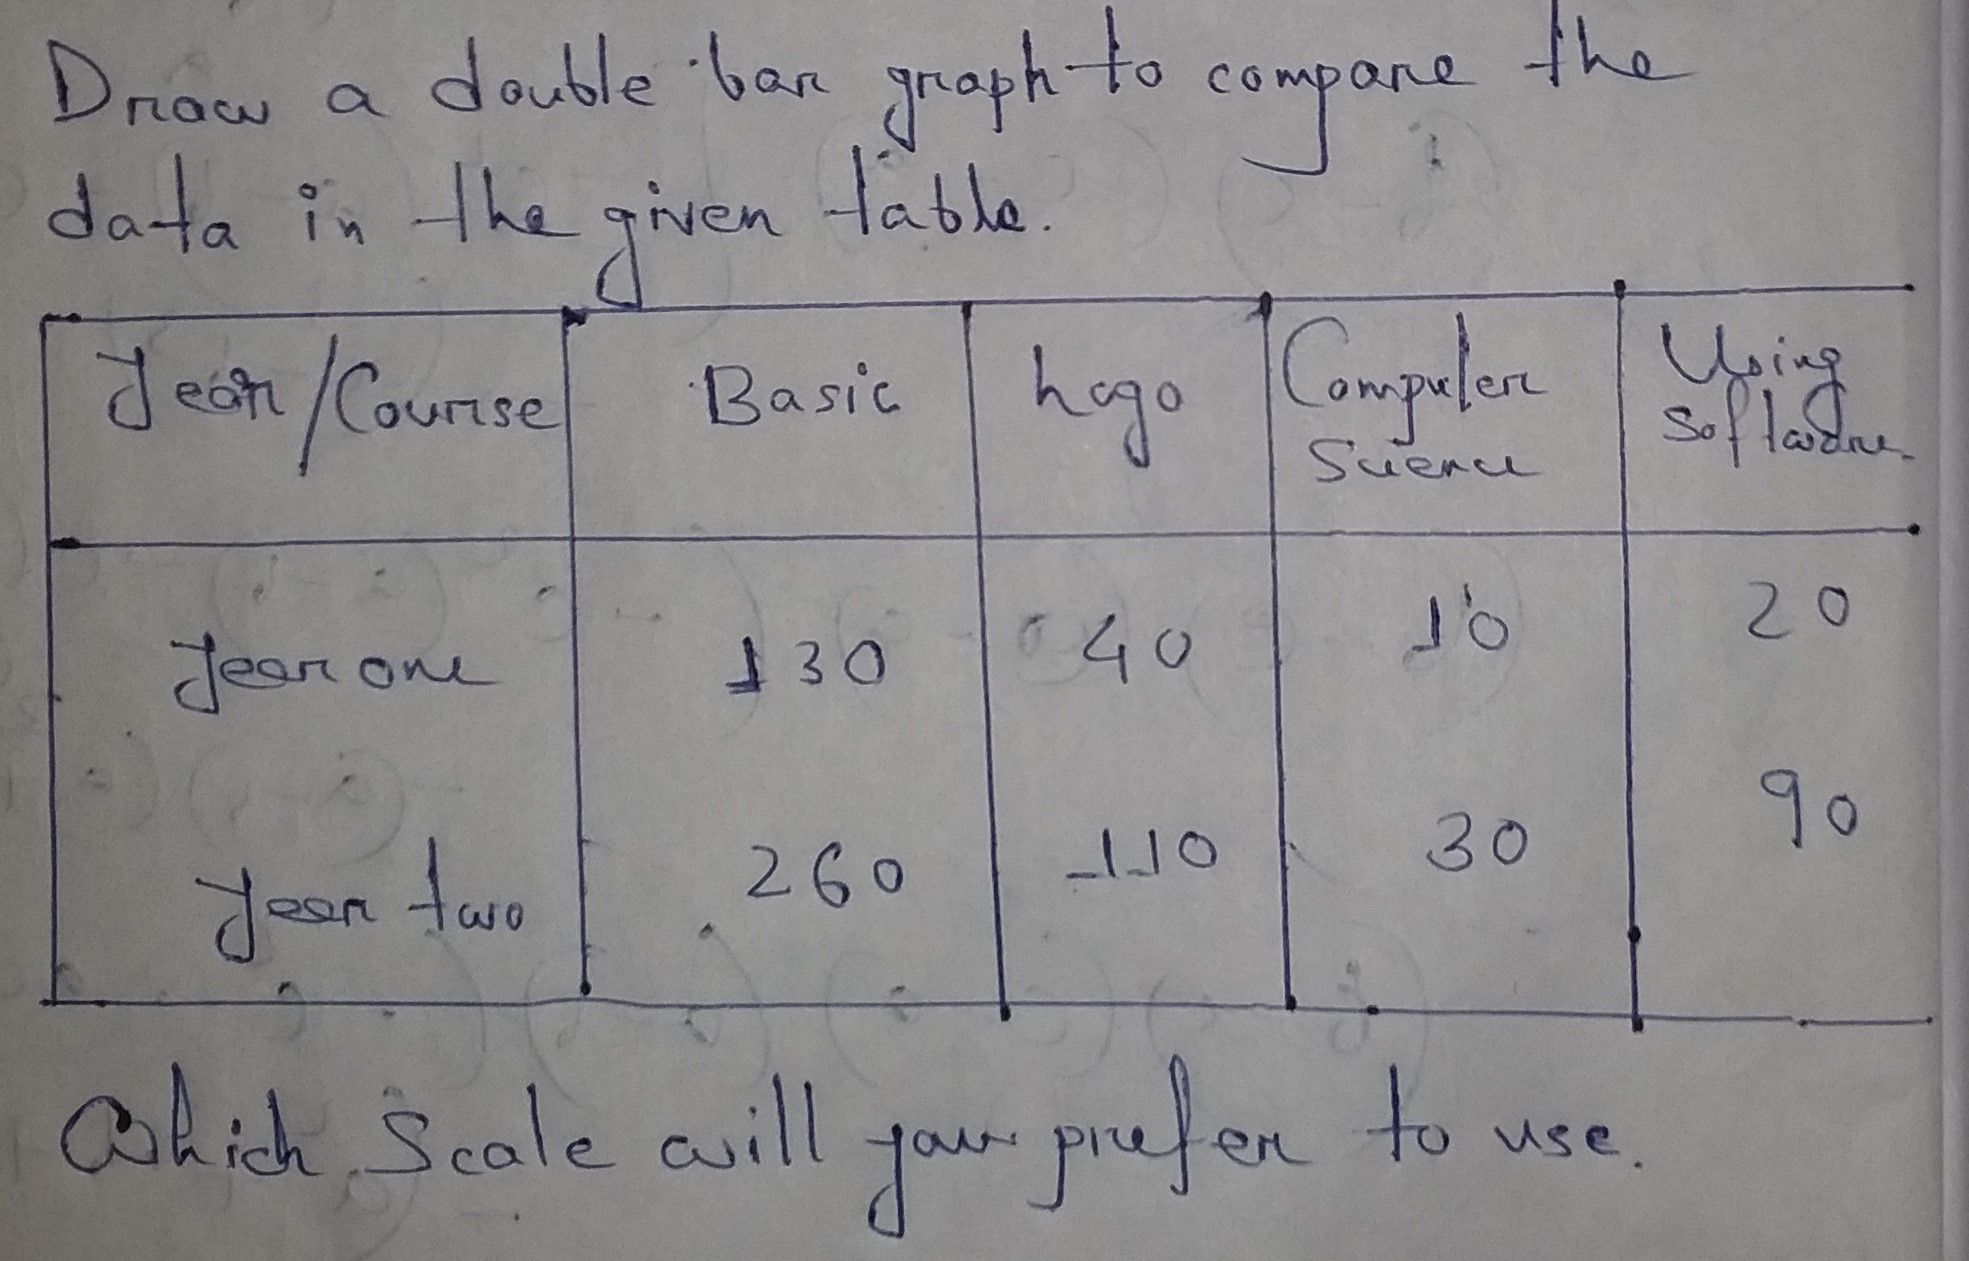
CBSE 7 - Maths
Asked by Topperlearning User | 21 May, 2015, 07:22: AM
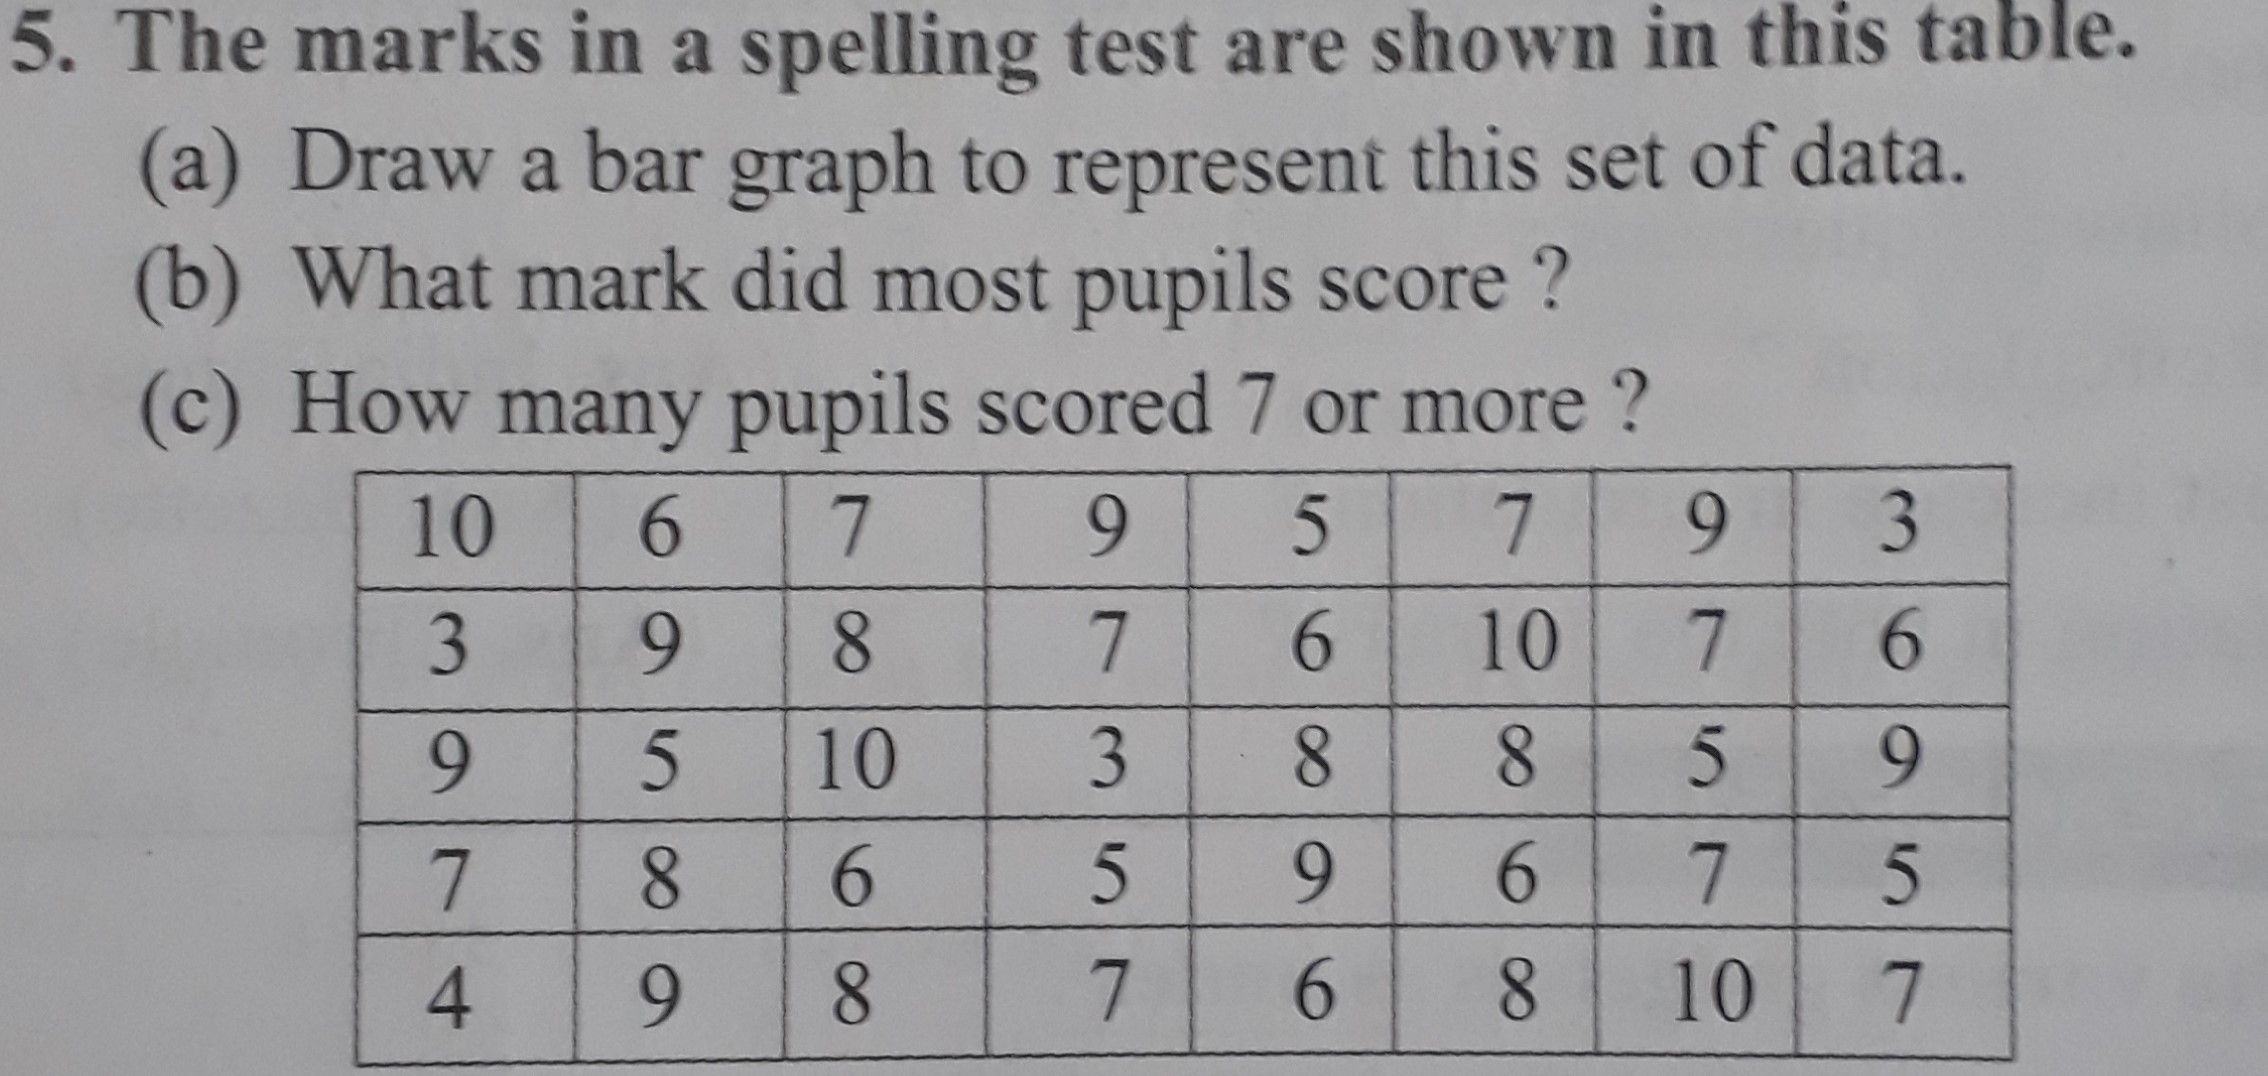
CBSE 7 - Maths
Asked by Topperlearning User | 10 Jul, 2014, 12:33: PM
