
CBSE Class 7 - Collection and Classification of Data Videos
Collection and classification of data
This video explains the concept of Data, Ways of Data Collection and Classification of Data
More videos from this chapter
View All-
Introduction to Probability

-
Arithmetic Mean
-
Collection and classification of data

-
Organising and Representing data
-
Double bar graphs

- Read the given table and answer the questions that follow: City Minimum Maximum Delhi 39oC 38oC Mumbai 34oC 35oC Kolkata 35oC 38oC Chennai 38oC 40oC Jaipur 39oC 42oC (a) Which cities have equal minimum temperature? (b) Which city has the highest maximum temperature?
- Consider table given below to answer the following questions: City Minimum Maximum Delhi 39oC 38oC Mumbai 34oC 35oC Kolkata 35oC 38oC Chennai 38oC 40oC Jaipur 39oC 42oC (a) What are the number of rows and columns in the table? (b) What information is given in the table?
-
Arrange the following data in ascending order of marks obtained out of 25 in Math by students in the year 2014.
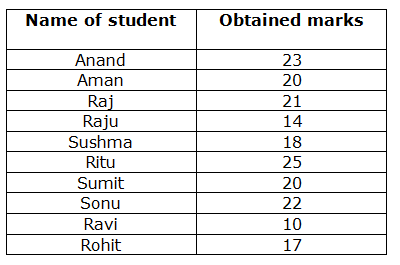 Which student got the highest marks?
- Consider the following table and answer the questions that follow. Name of student Weight(kg) Anand 35 Aman 50 Raj 51 Raju 64 Sushma 38 Ritu 35 Sumit 40 Sonu 35 Ravi 30 Rohit 35 (a) Who is the heaviest among all students? (b) What is the most common weight? (c) What is the difference of weight between the heaviest and the lightest student?
-
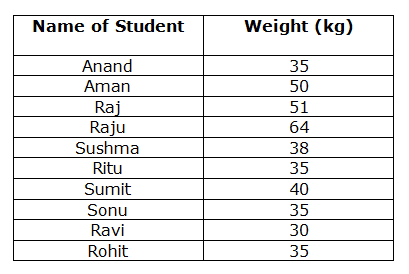 Consider the above table and answer the following questions: (a) What is the number of rows and columns in the table? (b) Arrange the following data in ascending order according to weight of students?
- Consider Standard VII of a school. There are four sections in class VII of a school as follows: Standard VII-A has 10 girls and 12 boys. Standard VII-B has 6 girls and 20 boys. Standard VII-C has 18 girls and 12 boys. Standard VII-D has 16 girls and 24 boys. (a) Tabulate the above data. (b) Count the total number of boys and girls from each section.
-
The following table shows the mode of transport opted by various students while travelling from home to school.
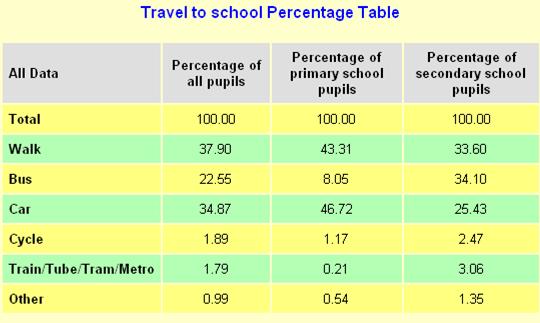 (a) Which is the most popular way of getting to school for primary pupils? (b) Which is the most common way of travelling to school for secondary pupils? (c) Which mode of transport is least popular amongst primary pupils?
- Make a list of 4 common pieces of data that can be organized from real life.
-
Many people visit Delhi every year. The exact visitor figures for 2009 and 2010 can be found in the table below. Use it to help you answer the below given questions.
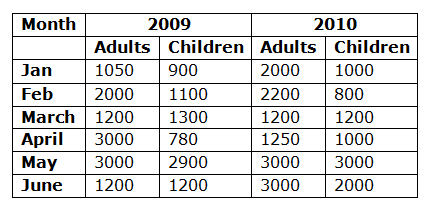 (a) Which months had the most adult visitors each year? (b) During which months did the most children visit each year? (c) Which months have same number of adults and children each year?
- Classify the following data as primary or secondary. (a) Classifying date of birth of different students from class attendance register. (b) Collecting Name, roll number information from each individual.
