CBSE Class 8 Answered
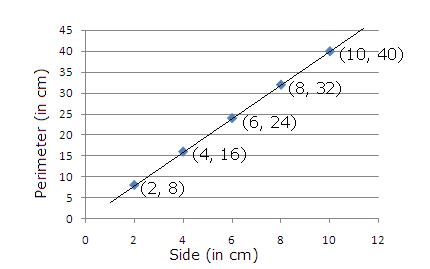
The following table shows the relation between side and the perimeter of a square.
Side (in cm)
2
4
6
8
10
Perimeter (in cm)
8
16
24
32
40
Represent this table in the form of a graph.
Asked by Topperlearning User | 04 Jun, 2014, 13:23: PM
Plotting the points (2, 8), (4, 16), (6, 24), (8, 32) and (10, 40) we get the graph as shown below:

Answered by | 04 Jun, 2014, 15:23: PM
Concept Videos
CBSE 8 - Maths
Asked by krushnagavande1978 | 18 Sep, 2019, 18:56: PM
CBSE 8 - Maths
Asked by Topperlearning User | 04 Jun, 2014, 13:23: PM
CBSE 8 - Maths
Asked by Topperlearning User | 04 Jun, 2014, 13:23: PM
CBSE 8 - Maths
Asked by Topperlearning User | 04 Jun, 2014, 13:23: PM
CBSE 8 - Maths
Asked by Topperlearning User | 04 Jun, 2014, 13:23: PM
CBSE 8 - Maths
Asked by Topperlearning User | 04 Jun, 2014, 13:23: PM
CBSE 8 - Maths
Asked by Topperlearning User | 04 Jun, 2014, 13:23: PM
CBSE 8 - Maths
Asked by Topperlearning User | 12 Dec, 2013, 01:39: AM
CBSE 8 - Maths
Asked by Topperlearning User | 13 Dec, 2013, 03:12: AM
CBSE 8 - Maths
Asked by Topperlearning User | 04 Jun, 2014, 13:23: PM


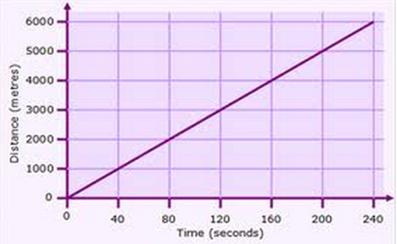
 Study the graph and answer the following questions.
(a) Find the distance covered in 80 seconds.
(b) The distance 5000 m is covered in what time?