
CBSE Class 8 Answered
Plot the graph for the following table and check whether it is a linear graph or not.
X
3
5
7
9
y
12
20
40
36
Asked by Topperlearning User | 04 Jun, 2014, 13:23: PM
Plotting the points (3, 12), (5, 20), (7, 40) and (9, 36) and joining them we get the following graph.
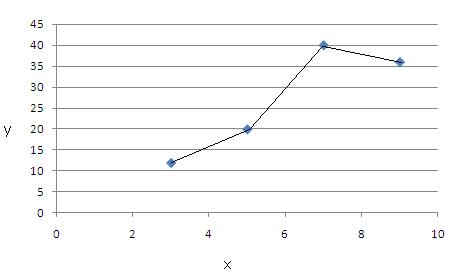
Clearly the graph is not a linear graph.
Answered by | 04 Jun, 2014, 15:23: PM
Concept Videos
-
Some Common Linear Graphs
 To draw some common linear graphs like quantity cost, principal and SI, dis...
CBSE 8 - Maths
Asked by krushnagavande1978 | 18 Sep, 2019, 18:56: PM
CBSE 8 - Maths
Asked by Topperlearning User | 04 Jun, 2014, 13:23: PM
CBSE 8 - Maths
Asked by Topperlearning User | 04 Jun, 2014, 13:23: PM
CBSE 8 - Maths
Asked by Topperlearning User | 04 Jun, 2014, 13:23: PM
CBSE 8 - Maths
Asked by Topperlearning User | 04 Jun, 2014, 13:23: PM
CBSE 8 - Maths
Asked by Topperlearning User | 04 Jun, 2014, 13:23: PM
CBSE 8 - Maths
Asked by Topperlearning User | 04 Jun, 2014, 13:23: PM
CBSE 8 - Maths
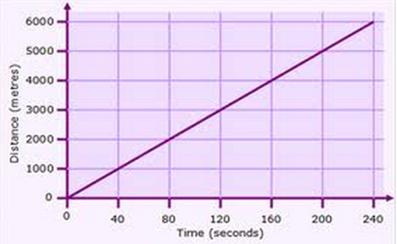 Study the graph and answer the following questions.
(a) Find the distance covered in 80 seconds.
(b) The distance 5000 m is covered in what time?
Study the graph and answer the following questions.
(a) Find the distance covered in 80 seconds.
(b) The distance 5000 m is covered in what time?Asked by Topperlearning User | 12 Dec, 2013, 01:39: AM
CBSE 8 - Maths
Asked by Topperlearning User | 13 Dec, 2013, 03:12: AM
CBSE 8 - Maths
Asked by Topperlearning User | 04 Jun, 2014, 13:23: PM
