
CBSE Class 8 - Some Common Linear Graphs Videos
Some Common Linear Graphs
To draw some common linear graphs like quantity cost, principal and SI, distance time and solve problem based on them.
More videos from this chapter
View All-
Introduction to Coordinate System
-
Some Common Linear Graphs
-
Plotting Linear Graphs
- What is a line graph ? What are the types of line grapes?
- A bank gives 10% simple interest on the deposits. Draw a graph to show the relation between the sum deposited and the simple interest earned.
- The following table shows the relation between side and the perimeter of a square. Side (in cm) 2 4 6 8 10 Perimeter (in cm) 8 16 24 32 40 Represent this table in the form of a graph.
- A metal piece is heated and its temperature is noted at different intervals and recorded in a tabular form. Time (in sec.) 2 6 10 14 Temperature (in oC) 19 27 35 43 Represent this table in the form of a graph.
- Plot the graph for the following table and check whether it is a linear graph or not. X 3 5 7 9 y 12 20 40 36
- Using a convenient scale plot the points for the multiples of 3.
- Two quantities x and y are related by the relation y = 5x + 3. Make a point table for 4 different values of x.
-
The following graph shows the relation between time and distance.
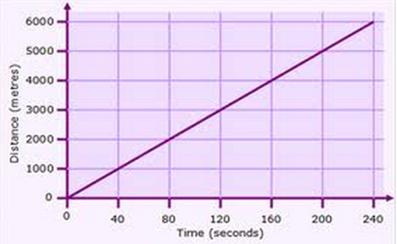 Study the graph and answer the following questions.
(a) Find the distance covered in 80 seconds.
(b) The distance 5000 m is covered in what time?
Study the graph and answer the following questions.
(a) Find the distance covered in 80 seconds.
(b) The distance 5000 m is covered in what time?
- Following table shows the relation between number of balls and their cost. Number of balls 5 10 20 Cost (in Rs) 15 30 60 Draw the graph for above data and hence find the cost of 15 balls.
- Following table shows the relation between number of books sold and the profit earned on it. Number of books sold 3 6 15 Profit earned (in Rs) 15 30 75 Draw the graph for above data and find the profit earned if 12 books are sold.
