
CBSE Class 8 Answered
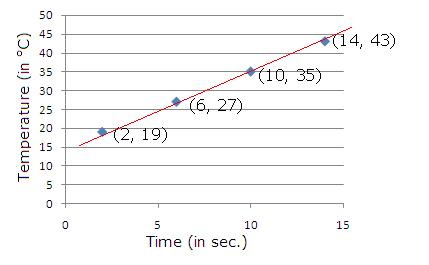
A metal piece is heated and its temperature is noted at different intervals and recorded in a tabular form.
Time (in sec.)
2
6
10
14
Temperature (in oC)
19
27
35
43
Represent this table in the form of a graph.
Asked by Topperlearning User | 04 Jun, 2014, 13:23: PM
Plotting the points (2, 19), (6, 27), (10, 35) and (14, 43), we get the following graph.
Answered by | 04 Jun, 2014, 15:23: PM
Concept Videos
-
Some Common Linear Graphs
 To draw some common linear graphs like quantity cost, principal and SI, dis...
CBSE 8 - Maths
Asked by krushnagavande1978 | 18 Sep, 2019, 18:56: PM
CBSE 8 - Maths
Asked by Topperlearning User | 04 Jun, 2014, 13:23: PM
CBSE 8 - Maths
Asked by Topperlearning User | 04 Jun, 2014, 13:23: PM
CBSE 8 - Maths
Asked by Topperlearning User | 04 Jun, 2014, 13:23: PM
CBSE 8 - Maths
Asked by Topperlearning User | 04 Jun, 2014, 13:23: PM
CBSE 8 - Maths
Asked by Topperlearning User | 04 Jun, 2014, 13:23: PM
CBSE 8 - Maths
Asked by Topperlearning User | 04 Jun, 2014, 13:23: PM
CBSE 8 - Maths
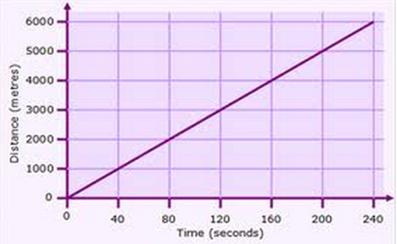 Study the graph and answer the following questions.
(a) Find the distance covered in 80 seconds.
(b) The distance 5000 m is covered in what time?
Study the graph and answer the following questions.
(a) Find the distance covered in 80 seconds.
(b) The distance 5000 m is covered in what time?Asked by Topperlearning User | 12 Dec, 2013, 01:39: AM
CBSE 8 - Maths
Asked by Topperlearning User | 13 Dec, 2013, 03:12: AM
CBSE 8 - Maths
Asked by Topperlearning User | 04 Jun, 2014, 13:23: PM
