CBSE Class 11-science Answered
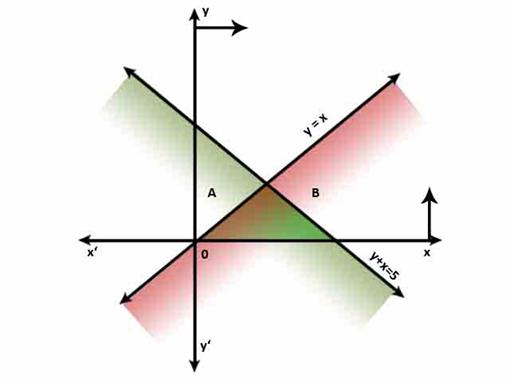
Solve the system of inequations graphically x  y, y + x
  5, x, y
  0
0
 y, y + x
  5, x, y
  0
0
Asked by Topperlearning User | 30 Apr, 2014, 11:19: AM
We draw the graphs of the linear equations x = y and x + y = 5 in the same plane.For shading the region for x y, we take a point, say (2, 0) substitute it in the inequality
x  y i.e. 2
  0.
0.
Clearly the inequality is satisfied hence the region B will be shaded for x  y. Thus, the region shaded in red colour will represent the inequality x
  y.
y.
Similarly we can see that region coloured in green represents the inequality
x + y  5.
5.
Also x  0, y
0, y  0 means that we are in the first quadrant.
So the doubly shaded region in the shape of a triangle is the required region.

Answered by | 30 Apr, 2014, 13:19: PM
Concept Videos
CBSE 11-science - Maths
Asked by mohvijayjain12 | 22 Jun, 2022, 11:07: AM
CBSE 11-science - Maths
Asked by swajaydixit04 | 19 Jun, 2020, 22:22: PM
CBSE 11-science - Maths
Asked by Topperlearning User | 30 Apr, 2014, 11:19: AM
CBSE 11-science - Maths
Asked by Topperlearning User | 30 Apr, 2014, 11:22: AM
CBSE 11-science - Maths
Asked by Topperlearning User | 30 Apr, 2014, 12:38: PM
CBSE 11-science - Maths
Asked by Topperlearning User | 04 Jun, 2014, 13:23: PM
CBSE 11-science - Maths
Asked by Topperlearning User | 04 Jun, 2014, 13:23: PM
CBSE 11-science - Maths
Asked by Topperlearning User | 04 Jun, 2014, 13:23: PM
CBSE 11-science - Maths
Asked by Topperlearning User | 04 Jun, 2014, 13:23: PM
CBSE 11-science - Maths
Asked by Topperlearning User | 04 Jun, 2014, 13:23: PM


 y, y + x
  5, x, y