
CBSE Class 9 Answered
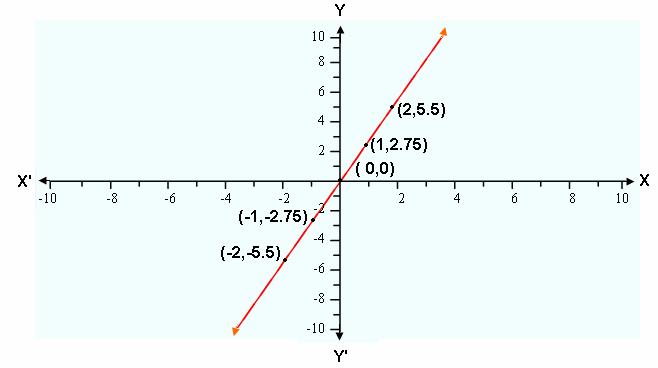
Draw the graph of the equation:
 ?
?
Asked by Topperlearning User | 28 Aug, 2017, 10:39: AM
When x=0 then y=0.

Similarly , when x= 2 then y=5.5 and when x=1 then the value of y=2.75
Let us find the solutions in ordered pair in the form of table as follows:
|
X
|
-1
|
-2
|
2
|
0
|
1
|
|
Y
|
-2.75
|
-5.5
|
5.5
|
0
|
2.75
|
Answered by | 28 Aug, 2017, 12:39: PM
Application Videos
-
Solution of Linear Equations in two variables graphical ...
 This video explains how to draw the graph of a linear equation and to find ...
 -
Appilcations based problem on Linear Equation in two va ...
 This video explains how to form a linear equation using given statements an...
Concept Videos
-
Solving linear equations using graphs
 Representing linear equation in both x and y axes and find solution of a pa...
 -
Graphical Representation
 This video explains how to represent a linear equation in both x and y axes...
 -
Representing Linear Equation in X and Y axes
 Representing linear equation in both x and y axes and find solution of a pa...
CBSE 9 - Maths

Asked by saee.shinde3069 | 31 Mar, 2024, 22:12: PM
CBSE 9 - Maths
Asked by diesh2323 | 08 May, 2022, 17:06: PM
CBSE 9 - Maths
Asked by kalamathanomkeshwarrao | 07 Nov, 2021, 16:08: PM
CBSE 9 - Maths
Asked by biengme321 | 09 Aug, 2020, 14:14: PM
CBSE 9 - Maths
Asked by Imrantahirshreyas | 14 Jun, 2020, 16:15: PM
CBSE 9 - Maths
Asked by akshatkumar1506 | 28 May, 2019, 08:31: AM
CBSE 9 - Maths
Asked by Topperlearning User | 31 Aug, 2017, 15:41: PM
CBSE 9 - Maths
Asked by Topperlearning User | 28 Aug, 2017, 10:38: AM
CBSE 9 - Maths
Asked by Topperlearning User | 28 Aug, 2017, 10:39: AM
