CBSE Class 9 Answered
Draw Graph for y=2x
Asked by sadhil73 | 18 Jun, 2019, 14:43: PM
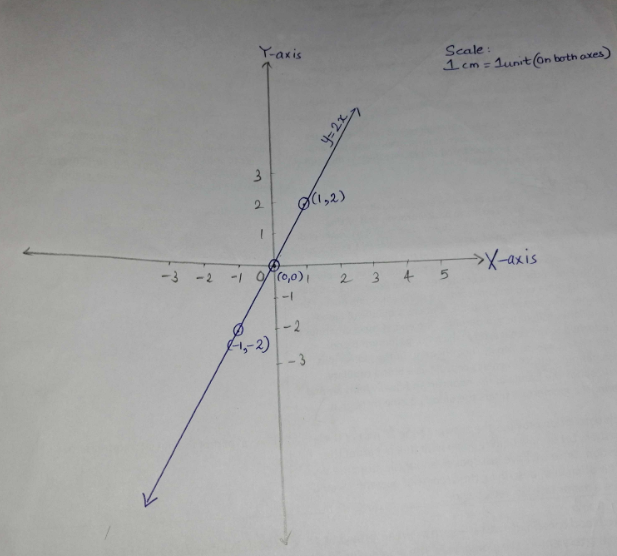
y = 2x
When x = 0 then y = 0
When x = 1 then y = 2
When x = -1 then y = -2
Plot the points (0, 0), (1, 2) and (-1, -2) on the graph paper.

Answered by Yasmeen Khan | 18 Jun, 2019, 15:32: PM
Application Videos
Concept Videos
CBSE 9 - Maths
Asked by saee.shinde3069 | 31 Mar, 2024, 22:12: PM
CBSE 9 - Maths
Asked by diesh2323 | 08 May, 2022, 17:06: PM
CBSE 9 - Maths
Asked by kalamathanomkeshwarrao | 07 Nov, 2021, 16:08: PM
CBSE 9 - Maths
Asked by biengme321 | 09 Aug, 2020, 14:14: PM
CBSE 9 - Maths
Asked by Imrantahirshreyas | 14 Jun, 2020, 16:15: PM
CBSE 9 - Maths
Asked by akshatkumar1506 | 28 May, 2019, 08:31: AM
CBSE 9 - Maths
Asked by Topperlearning User | 31 Aug, 2017, 15:41: PM
CBSE 9 - Maths
Asked by Topperlearning User | 28 Aug, 2017, 10:38: AM
CBSE 9 - Maths
Asked by Topperlearning User | 28 Aug, 2017, 10:39: AM


