CBSE Class 9 Answered
The
following table gives the number of pairs of shoes and their corresponding
price. Plot these as ordered pairs and join them. What type of graph do you
get?
Number
of pairs of shoes
1
2
3
4
5
6
Corresponding
prices (in hundred or rupees)
5
10
15
20
25
30
Asked by Topperlearning User | 04 Jun, 2014, 01:23: PM
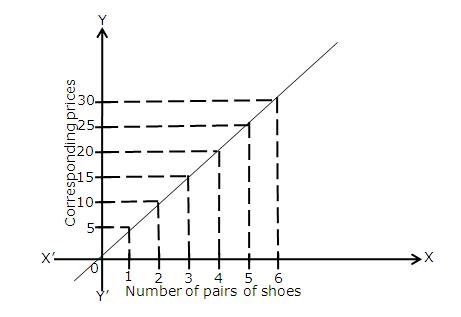
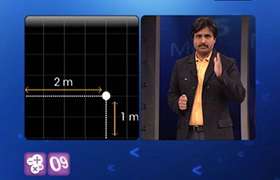
The graph obtained is a straight line.
Answered by | 04 Jun, 2014, 03:23: PM
Application Videos
-
Coordinate Geometry - 1
This video explains a case study based question on finding the coordinat...
Concept Videos
-
Cartesian Plane ...
 This video explains the basic concepts of Coordinate Geometry, discusses qu...
 -
Concepts of Coordinate Geometry
 Understand the basic concepts of Coordinate Geometry and discuss quadrants ...
 -
Basic concepts of Coordinate Geometry
 Understand the basic concepts of Coordinate Geometry and discuss quadrants ...
CBSE 9 - Maths
Asked by mailtoparvathyprajith | 04 Mar, 2024, 09:53: AM
CBSE 9 - Maths
Asked by masinenisriharsha | 23 Oct, 2021, 08:58: PM
CBSE 9 - Maths
Asked by adarsh.sharma1042 | 28 Aug, 2021, 07:27: AM
CBSE 9 - Maths
Asked by rohitmitali07 | 07 Jun, 2021, 07:30: PM
CBSE 9 - Maths
Asked by amritabaraily74 | 21 May, 2021, 05:38: PM
CBSE 9 - Maths
Asked by pvnathan | 24 Mar, 2021, 09:22: AM
CBSE 9 - Maths
Asked by ubarua269 | 24 Aug, 2020, 05:38: PM
CBSE 9 - Maths
if the coordinate of two points are A( -2,-5) and B(4,-6) then ( abscissa of A) - (abscissa of B) is
Asked by swatipuspapatel | 21 Aug, 2020, 08:38: PM