CBSE Class 11-science Answered
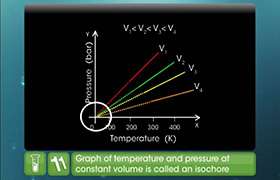
If a graph is plotted between volume V v/s temperature oC at constant pressure. At what temperatures will it cut the volume and temperature axis?
Asked by Topperlearning User | 20 Apr, 2015, 04:43: PM
The graph cuts the volume axis at 0oC and the temperature axis at -273.15 oC, which is also known as the absolute temperature.
Answered by | 20 Apr, 2015, 06:43: PM
Concept Videos
CBSE 11-science - Chemistry
Asked by rhythmdraco42 | 22 Apr, 2024, 10:43: PM
CBSE 11-science - Chemistry
Asked by vishalrolaniya2005 | 20 Sep, 2023, 08:58: PM
CBSE 11-science - Chemistry
Asked by amanpatel95698 | 02 Mar, 2022, 12:09: AM
CBSE 11-science - Chemistry
Asked by pushpakumari291279 | 31 Dec, 2020, 02:02: PM
CBSE 11-science - Chemistry
Asked by aryanvankar88 | 11 Oct, 2020, 10:07: PM
CBSE 11-science - Chemistry
Asked by devanshuchhipani | 12 Mar, 2020, 08:42: PM
CBSE 11-science - Chemistry
Asked by ritua7330 | 01 Sep, 2019, 12:53: PM
CBSE 11-science - Chemistry
Asked by sajidivakaran | 21 Jul, 2019, 09:41: AM
CBSE 11-science - Chemistry
Asked by shashank1854 | 28 May, 2019, 04:48: PM
CBSE 11-science - Chemistry
Asked by skkvaish | 23 May, 2019, 08:20: AM


