
5 Common Mistakes in ICSE Class 10 Chapter Graphical Representation
One of the most important units in the ICSE Class 10 syllabus is Statistics consisting of the chapters Graphical Representation. Here, most of the students make mistakes in creating graphs and also in finding the median and mode from the graph. Let us first briefly understand what graphs need to be studied in this chapter.
Histogram is a graphical representation of data of a continuous frequency distribution. It is made up of rectangles or bars of equal width. The height of each rectangle or bar is proportional to its corresponding frequency.
Grouped data are represented by a curve called cumulative frequency curve or an ogive.
Let us start to understand the MISTAKES committed by students one by one.
MISTAKE #1 – DATA – Histogram and Ogive
Failure in converting Discontinuous data into Continuous data.
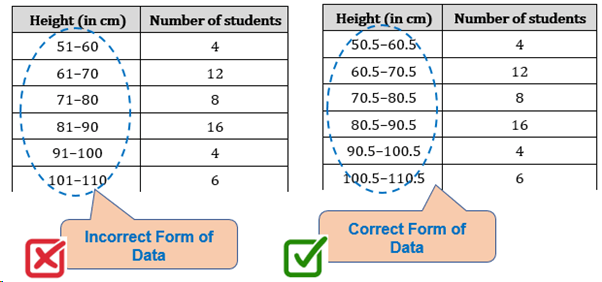
The very first step when you start creating a histogram or on ogive is to check whether the given data is continuous or discontinuous. If the data is continuous, we can proceed. But if data is discontinuous, WE HAVE TO MAKE IT CONTINUOUS.
Then, our data is ready for creating a graph.
MISTAKE #2 – KINK – Histogram and Ogive
Failure in showing a kink when the graph’s first point is not at the origin.
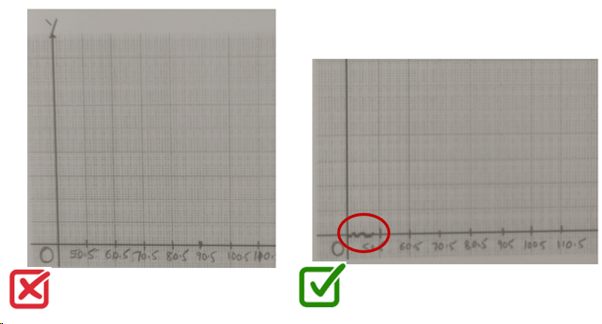
Since the graph is starting from point 50.5 and NOT the origin, a kink or a zig-zag curve needs to be drawn near the origin. This is an essential step in creating any graph. Most of the students plot both the axes correctly but skip to mark the kink resulting in loss of marks.
MISTAKE #3 – CUMULATIVE FREQUENCIES – Ogive
Failure in calculating correct cumulative frequencies.
The cumulative frequency of a class is the frequency obtained by adding the frequencies of all the classes preceding the given class to the frequency of the class.
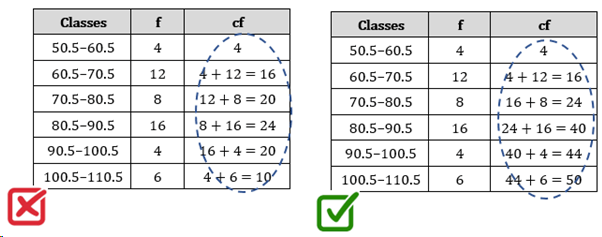
But sometimes, students do these calculations incorrectly and hence, the whole graph becomes wrong.
MISTAKE #4 – Starting Point and Upper Limits on X-axis – Ogive
Failure in plotting the lower limit of the first class interval with cumulative frequency 0.
An ogive is always started from a point on the X-axis representing the lower limit of the first class and ends at the upper limit of the last class.
|
Classes |
f |
c.f. |
|
0-10 |
4 |
4 |
|
10-20 |
7 |
11 |
|
20-30 |
9 |
20 |
|
30-40 |
8 |
28 |
|
40-50 |
3 |
31 |

While creating an ogive, we mark the upper-class limits on the X-axis and corresponding cumulative frequencies on the Y-axis. Along with that, it is also required to mark the lower class limit of the first class interval on the X-axis with its cumulative frequency as zero.
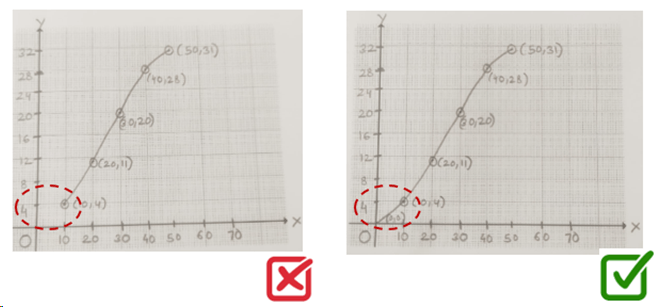
Most of the time, it has been observed that students directly start plotting points from the upper limit of the first class interval failing to plot the lower class limit of the first class interval.
Also, remember that the last point to be plotted is the upper-class limit of the last class interval along with its corresponding cumulative frequency.
MISTAKE #5 – MEDIAN – Ogive
Failure in getting the correct Median using ogive.
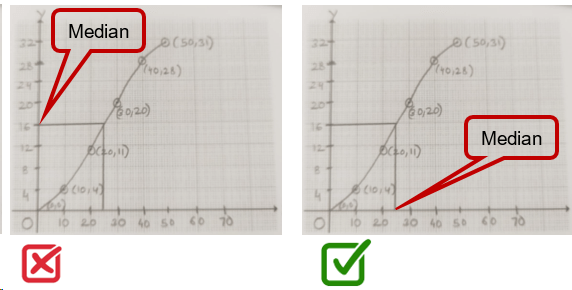
When it is asked to find the median from the ogive obtained, the most common mistake committed by students is they show the median on the Y-axis instead of showing it on the X-axis.
CONCLUSION
To score good marks in exams, do not forget to mark kink wherever required, plot the points correctly, mark the median in the graph without confusion or error. In short, avoid all the major 5 common mistakes mentioned in the blog while creating graphs. These mistakes are based on CISCE Pupil Analysis done in a year. A huge amount of quality resources is available at TopperLearning for your understanding such as Revision Note which explains all concepts of a chapter, Assertion and Reasoning Questions for practice and practical knowledge through Video.
|
Classes |
f |
c.f. |
|
0-10 |
4 |
4 |
|
10-20 |
7 |
11 |
|
20-30 |
9 |
20 |
|
30-40 |
8 |
28 |
|
40-50 |
3 |
31 |
More from Education


Important Resources
- Education Franchisee opportunity
- NCERT Solution
- CBSE Class 9 Mathematics
- NCERT Solutions for class 10 Science
- Sample Papers
- CBSE Class 9 Science
- NCERT Solutions for class 10 Maths
- Revision Notes
- CBSE Class 10 Hindi
- CBSE Class 10 English
- CBSE Class 10 English
- CBSE Class 10 Social Studies
- CBSE Class 10 Science
- CBSE Class 10 Mathematics
- Career In Science After 10
- Career In Commerce After 10
- Career In Humanities/Arts After 10
- NCERT Solutions for Class 10
- NCERT Solutions for Class 11
- Business Studies Class 12 CBSE project
