
CBSE Class 12-science Answered
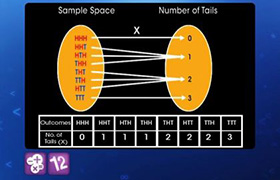
Write the probability distribution table and find the mean of the variable Y whose probability distribution is given graphically.
Asked by Topperlearning User | 04 Jun, 2014, 13:23: PM
Answered by | 04 Jun, 2014, 15:23: PM
Concept Videos
-
Distribution of Random Variables
 Distribution of Random Variables
 -
Distribution of Random Variables ...
 This video covers examples and concepts related to Distribution of Random V...
 -
Concepts on distribution of random variables
 This video deals with the concepts of random variables.
CBSE 12-science - Maths
Asked by rairp2017 | 27 May, 2021, 00:21: AM
CBSE 12-science - Maths
Asked by haroonrashidgkp | 07 Nov, 2018, 21:16: PM
CBSE 12-science - Maths
Asked by haroonrashidgkp | 05 Nov, 2018, 21:37: PM
CBSE 12-science - Maths
Asked by Topperlearning User | 04 Jun, 2014, 13:23: PM
CBSE 12-science - Maths
Asked by Topperlearning User | 04 Jun, 2014, 13:23: PM
CBSE 12-science - Maths
Asked by Topperlearning User | 04 Jun, 2014, 13:23: PM
CBSE 12-science - Maths
Asked by Topperlearning User | 04 Jun, 2014, 13:23: PM
CBSE 12-science - Maths
Asked by Topperlearning User | 04 Jun, 2014, 13:23: PM
CBSE 12-science - Maths
Asked by Topperlearning User | 04 Jun, 2014, 13:23: PM
