
CBSE Class 8 Answered
what is bar graph
Asked by dineshchandragpt4 | 19 Mar, 2018, 07:10: PM
A Bar Graph is a graphical representation of a Categorized Data using Bars of different heights.
Example :
A Survey of 145 people asked them "Which is the nicest fruit ?"


With the help pf given Bar Graph we can directly say that people think Blueberries are the nicest and Banana is the least nicest.
Answered by Yasmeen Khan | 20 Mar, 2018, 10:43: AM
Application Videos
-
Solving Linear Equations in one variable
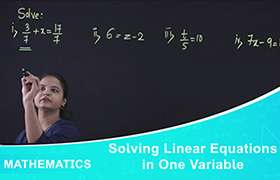 This video explains the method of finding the solutions of given linear equ...
 -
Linear Equations to Simpler Form
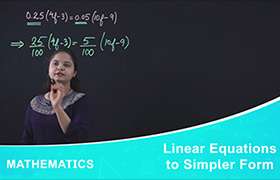 This video explince the concept of Linear Equations to Simpler Form.
 -
Equations Reducible to the Linear Form
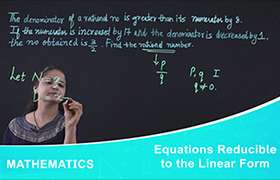 This video explains the concept of Equations Reducible to the Linear Form.
 -
Sum of the Measures of the Exterior Angles of a Polygon ...
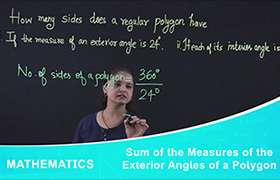 This video explains the method of finding number of sides of a polygon if t...
 -
Grouped Frequency Distribution Table
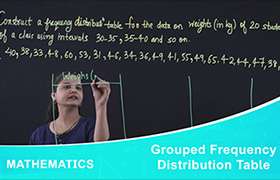 This video explains the method of constructing the Grouped Frequency Distri...
Concept Videos
-
Construction of Rhombus
 Construction of rhombus given side and angle, both diagonals
 -
Construction of squares and rectangles
 construction of square given side and diagonals,construction of rectangles
 -
Quadrilaterals
 Definition, elements, angle sum property, classification of quadrilaterals
 -
Surface Area: Cubes and Cuboids
 cubes and cuboids, finding their surface area
 -
Bar Graphs and Histograms
 bar graph, histogram their interpretation,comparison of the two
CBSE 8 - Maths
Asked by chauhannaman12b | 25 Apr, 2024, 09:33: PM
CBSE 8 - Maths
Asked by gk9941740 | 23 Apr, 2024, 05:13: PM
CBSE 8 - Maths
Asked by pinkiyadav79919 | 22 Apr, 2024, 08:03: PM
CBSE 8 - Maths
Asked by hk1354035 | 20 Apr, 2024, 06:33: AM
CBSE 8 - Maths
Asked by kaminiverma8787 | 16 Apr, 2024, 04:22: PM
CBSE 8 - Maths
Asked by chauhanshivansh112 | 15 Apr, 2024, 08:41: PM
CBSE 8 - Maths
Asked by anuragprasad24311 | 03 Apr, 2024, 01:07: PM
CBSE 8 - Maths
Asked by padmadandu1207 | 02 Apr, 2024, 10:25: PM
CBSE 8 - Maths
Asked by rathlavathpandu601 | 31 Mar, 2024, 08:33: AM
