
CBSE Class 7 Answered
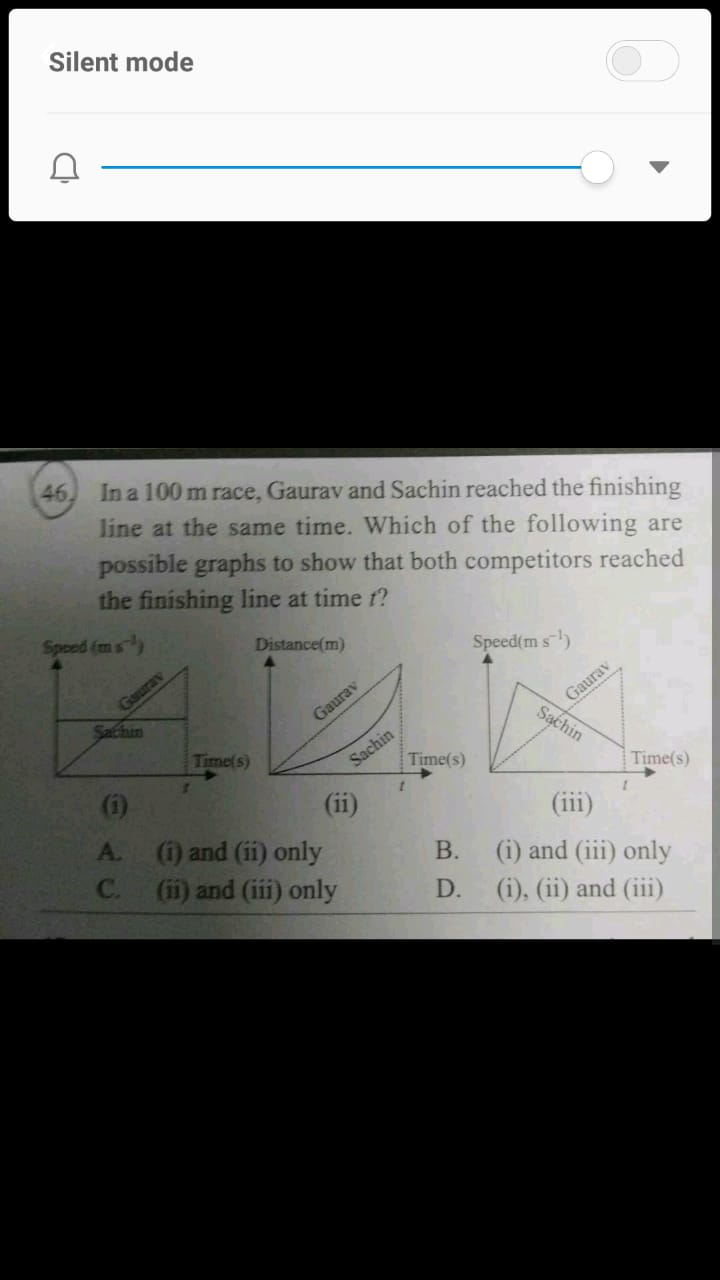
In a 100 meter race, Gourav and Sachin reached the finishing line at the same time. Which of the following are the possible graphs to show that both competitors reached the finishing line at time 't'.
Asked by sahooarupkumar3 | 05 Oct, 2018, 13:01: PM
When it is a race, an individual starts from the state of rest, that is when the speed and the distance covered is zero.
In graph (i), the speed of Gaurav starts from zero, whereas, Sachin starts the race from a non zero speed, which is practically impossible when a race starts.
Graph (ii) shows Gaurav and Sachin starting the race from the distance 0 and reach same distance (the race end point) at the same point of time. This representation is practically possible for describing the motion of race participants.
Graph (iii) shows Gaurav and Sachin starting the race from the speed of 0 and finish the race at the same time but at different speeds, this is also a practically possible representation of the motion of race participants.
Thus, Option C, graph (ii) and (iii) are the possible graphs to show that both competitors reached the finishing line at time 't'
Answered by Abhijeet Mishra | 05 Oct, 2018, 14:39: PM
Concept Videos

CBSE 7 - Science
Asked by damarlapallimahesh | 23 Jun, 2022, 20:14: PM
CBSE 7 - Science
Asked by yamantakkarodpati38.7tpstl | 18 Jul, 2020, 17:09: PM
CBSE 7 - Science
Asked by mamta021082 | 26 Jun, 2020, 21:23: PM
CBSE 7 - Science
Asked by 20170163881 | 08 May, 2020, 11:24: AM
CBSE 7 - Science
Asked by VAshwika23 | 18 Dec, 2019, 06:46: AM
CBSE 7 - Science
Asked by rvmitteygr | 13 Sep, 2019, 21:34: PM
CBSE 7 - Science
Asked by sujayavi2 | 09 Oct, 2018, 10:08: AM
CBSE 7 - Science
Asked by sahooarupkumar3 | 05 Oct, 2018, 13:01: PM
CBSE 7 - Science
Asked by Shreeya Nemani | 28 Aug, 2018, 20:23: PM
CBSE 7 - Science
Asked by Shreeya Nemani | 28 Aug, 2018, 20:17: PM
