
CBSE Class 11-science Answered
Draw the graph of y = sinx, 


Asked by Topperlearning User | 04 Jun, 2014, 13:23: PM
To draw the graph, we shall first find the values of x in the interval [0, ].
].
We know that,

So, the graph of the given function is as follows.
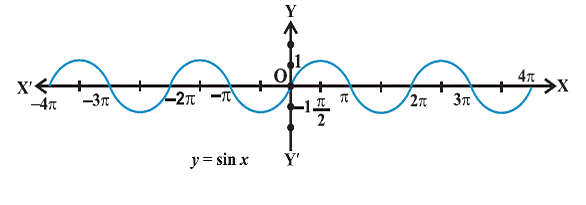
Answered by | 04 Jun, 2014, 15:23: PM
Concept Videos
-
Graphs of Trigonometric Function
 Define the domain, period and range of the trigonometric functions and plo...
 -
Understand domain, period and range of the trigonometri ...
 Define the domain, period and range of the trigonometric functions and plot...
 -
Domain, period and range of trigonometric functions ...
 Define the domain, period and range of the trigonometric functions and plot...
CBSE 11-science - Maths
Asked by vikasg13.hardware | 22 Jun, 2018, 21:47: PM
CBSE 11-science - Maths
Asked by arunavamitra50 | 13 Jun, 2018, 19:32: PM
CBSE 11-science - Maths
Asked by Topperlearning User | 04 Jun, 2014, 13:23: PM
CBSE 11-science - Maths
Asked by Topperlearning User | 04 Jun, 2014, 13:23: PM
CBSE 11-science - Maths
Asked by Topperlearning User | 04 Jun, 2014, 13:23: PM
CBSE 11-science - Maths
Asked by Topperlearning User | 04 Jun, 2014, 13:23: PM
CBSE 11-science - Maths
Asked by Topperlearning User | 31 May, 2016, 11:05: AM
CBSE 11-science - Maths
Asked by Topperlearning User | 04 Jun, 2014, 13:23: PM
CBSE 11-science - Maths
Asked by Topperlearning User | 04 Jun, 2014, 13:23: PM
CBSE 11-science - Maths
Asked by Topperlearning User | 31 May, 2016, 10:27: AM
