ICSE Class 10 Maths Histogram and Ogive
-
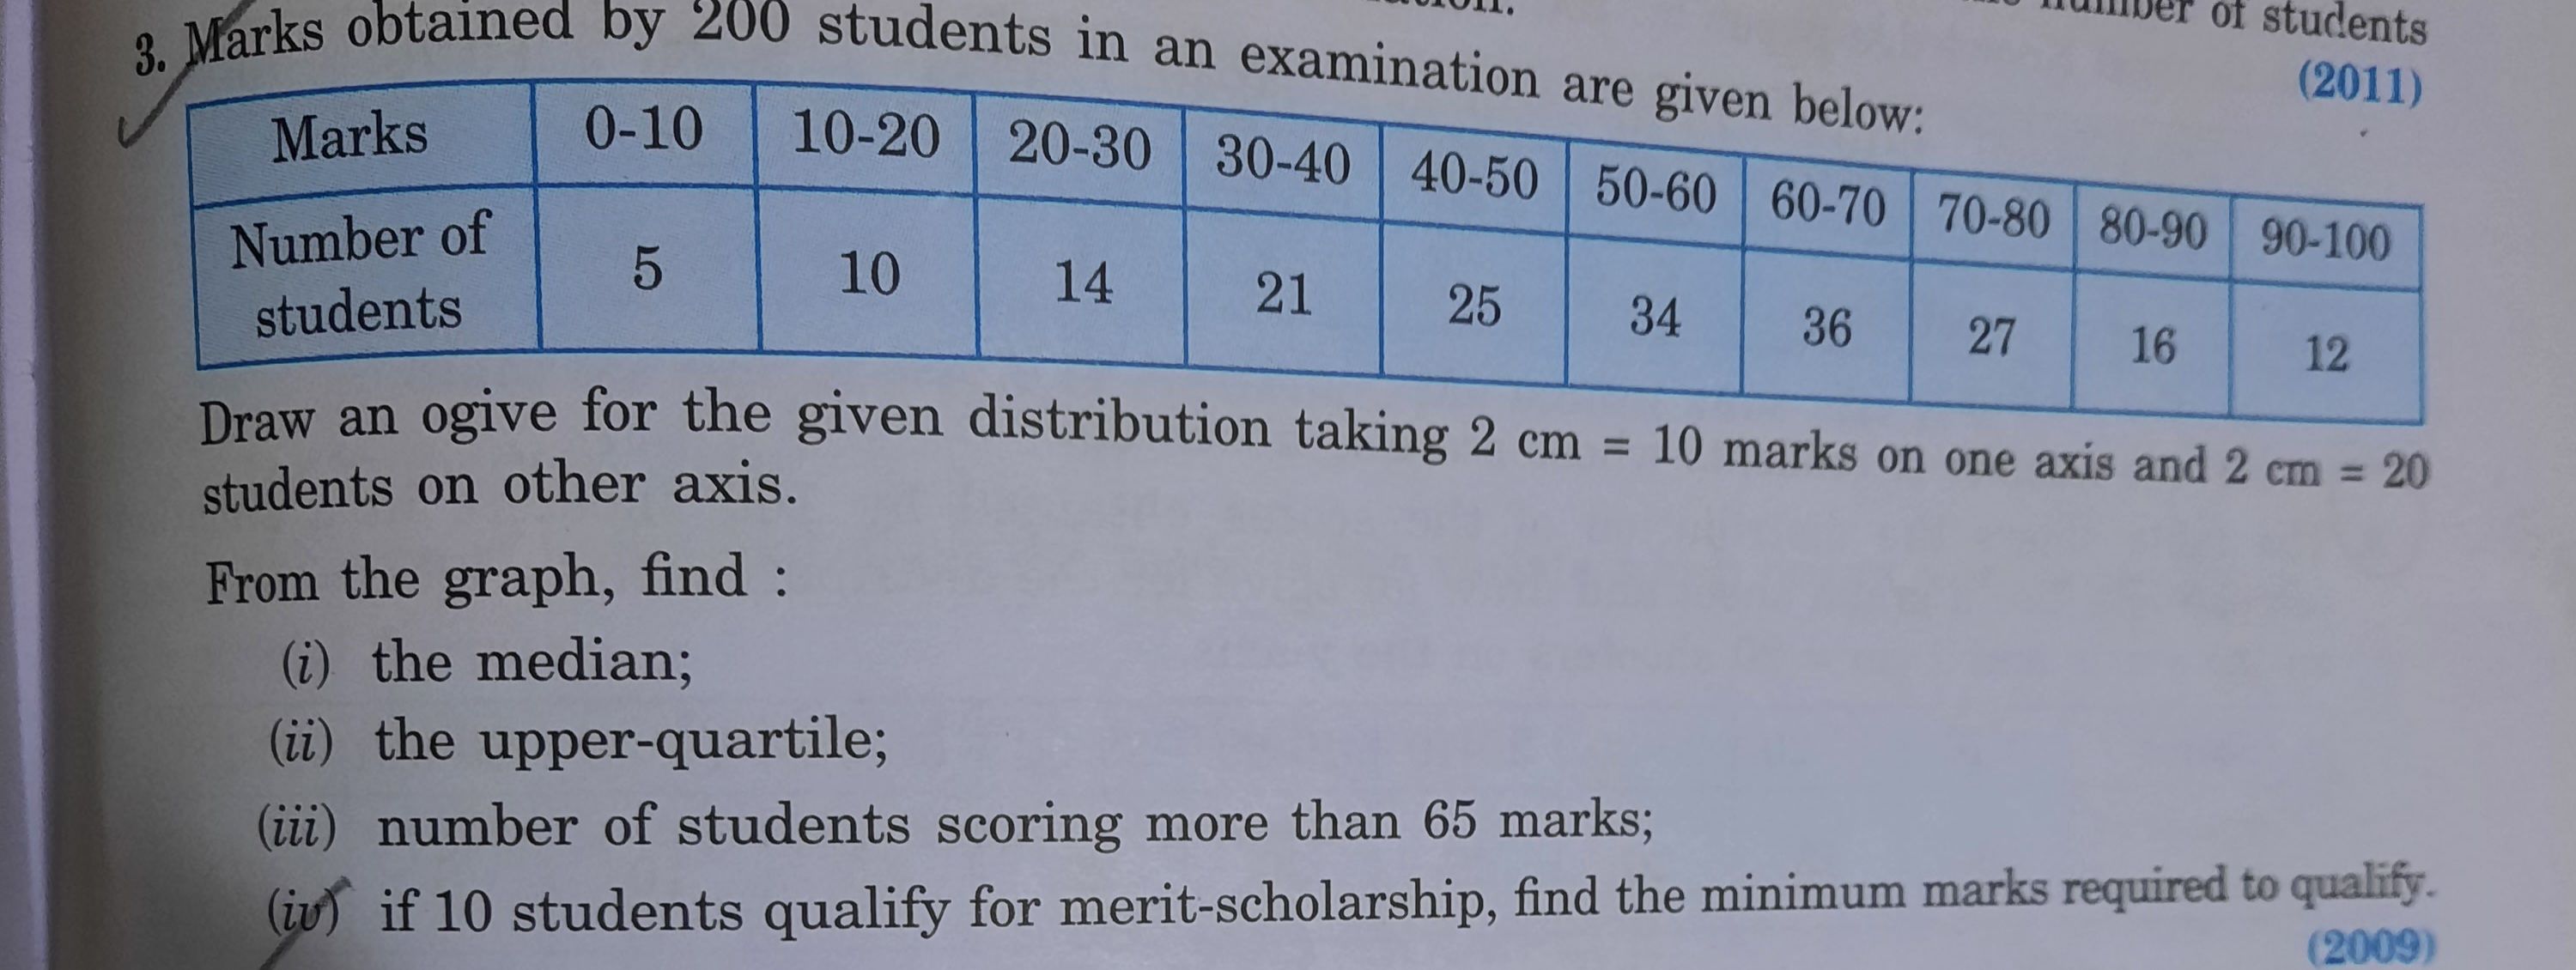
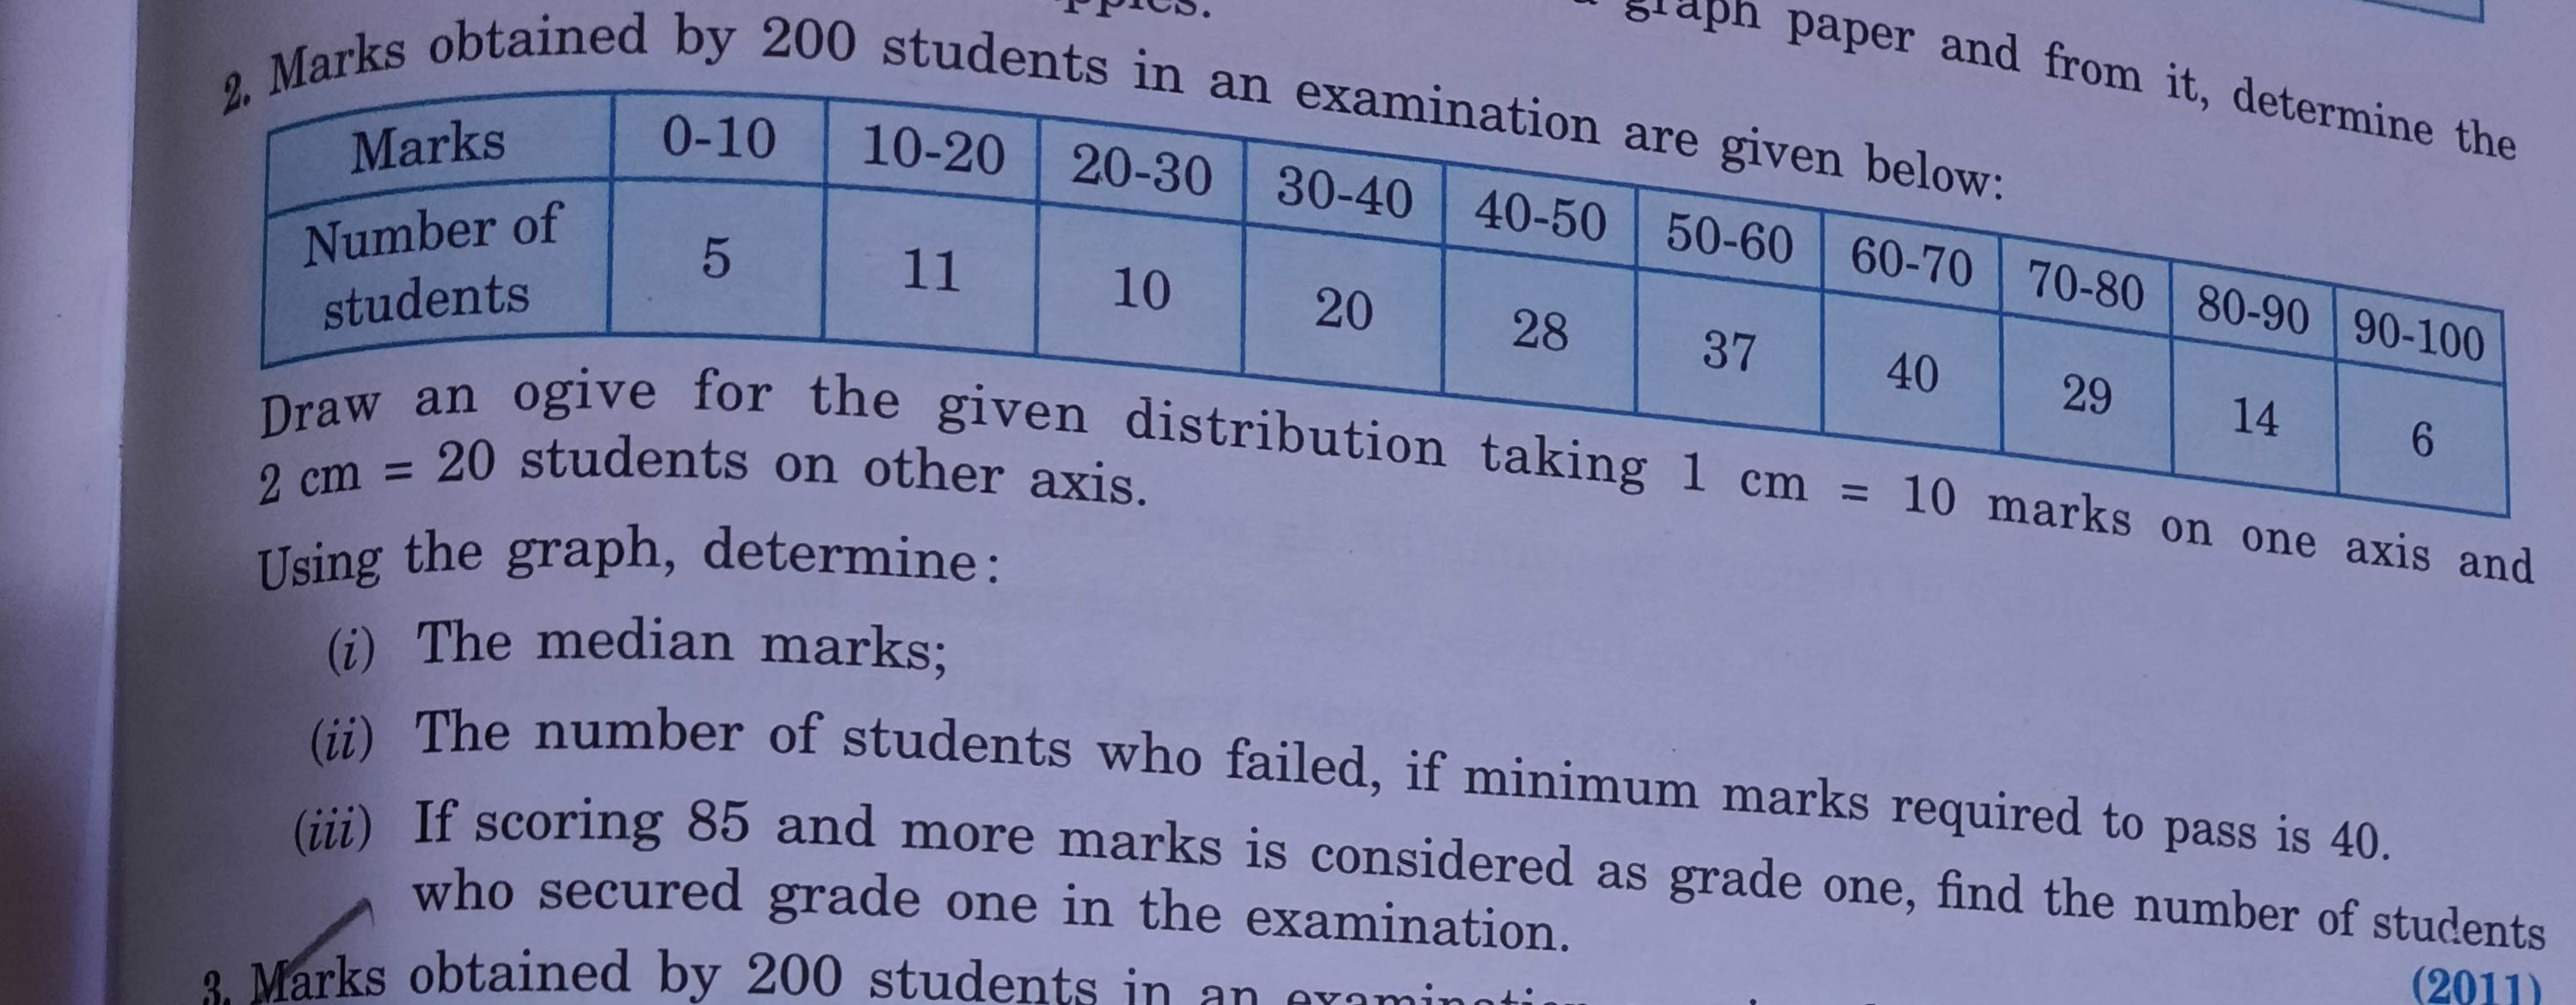
How to solve the question and plot the graph?

-
How to solve the question and plot the graph?

-
How do we find the co-orinates of x-axis and y-axis & also plot the graph?

- How do we scale the x-axis & y-axis to plot the graph in ogive? Does the values of the scale depend on the values of the co-ordinates of the x-axis and y-axis? Thanks.


