
ICSE Class 10 Answered
How to solve the question and plot the graph?
Asked by rashikulkarni28 | 25 Jun, 2022, 18:44: PM
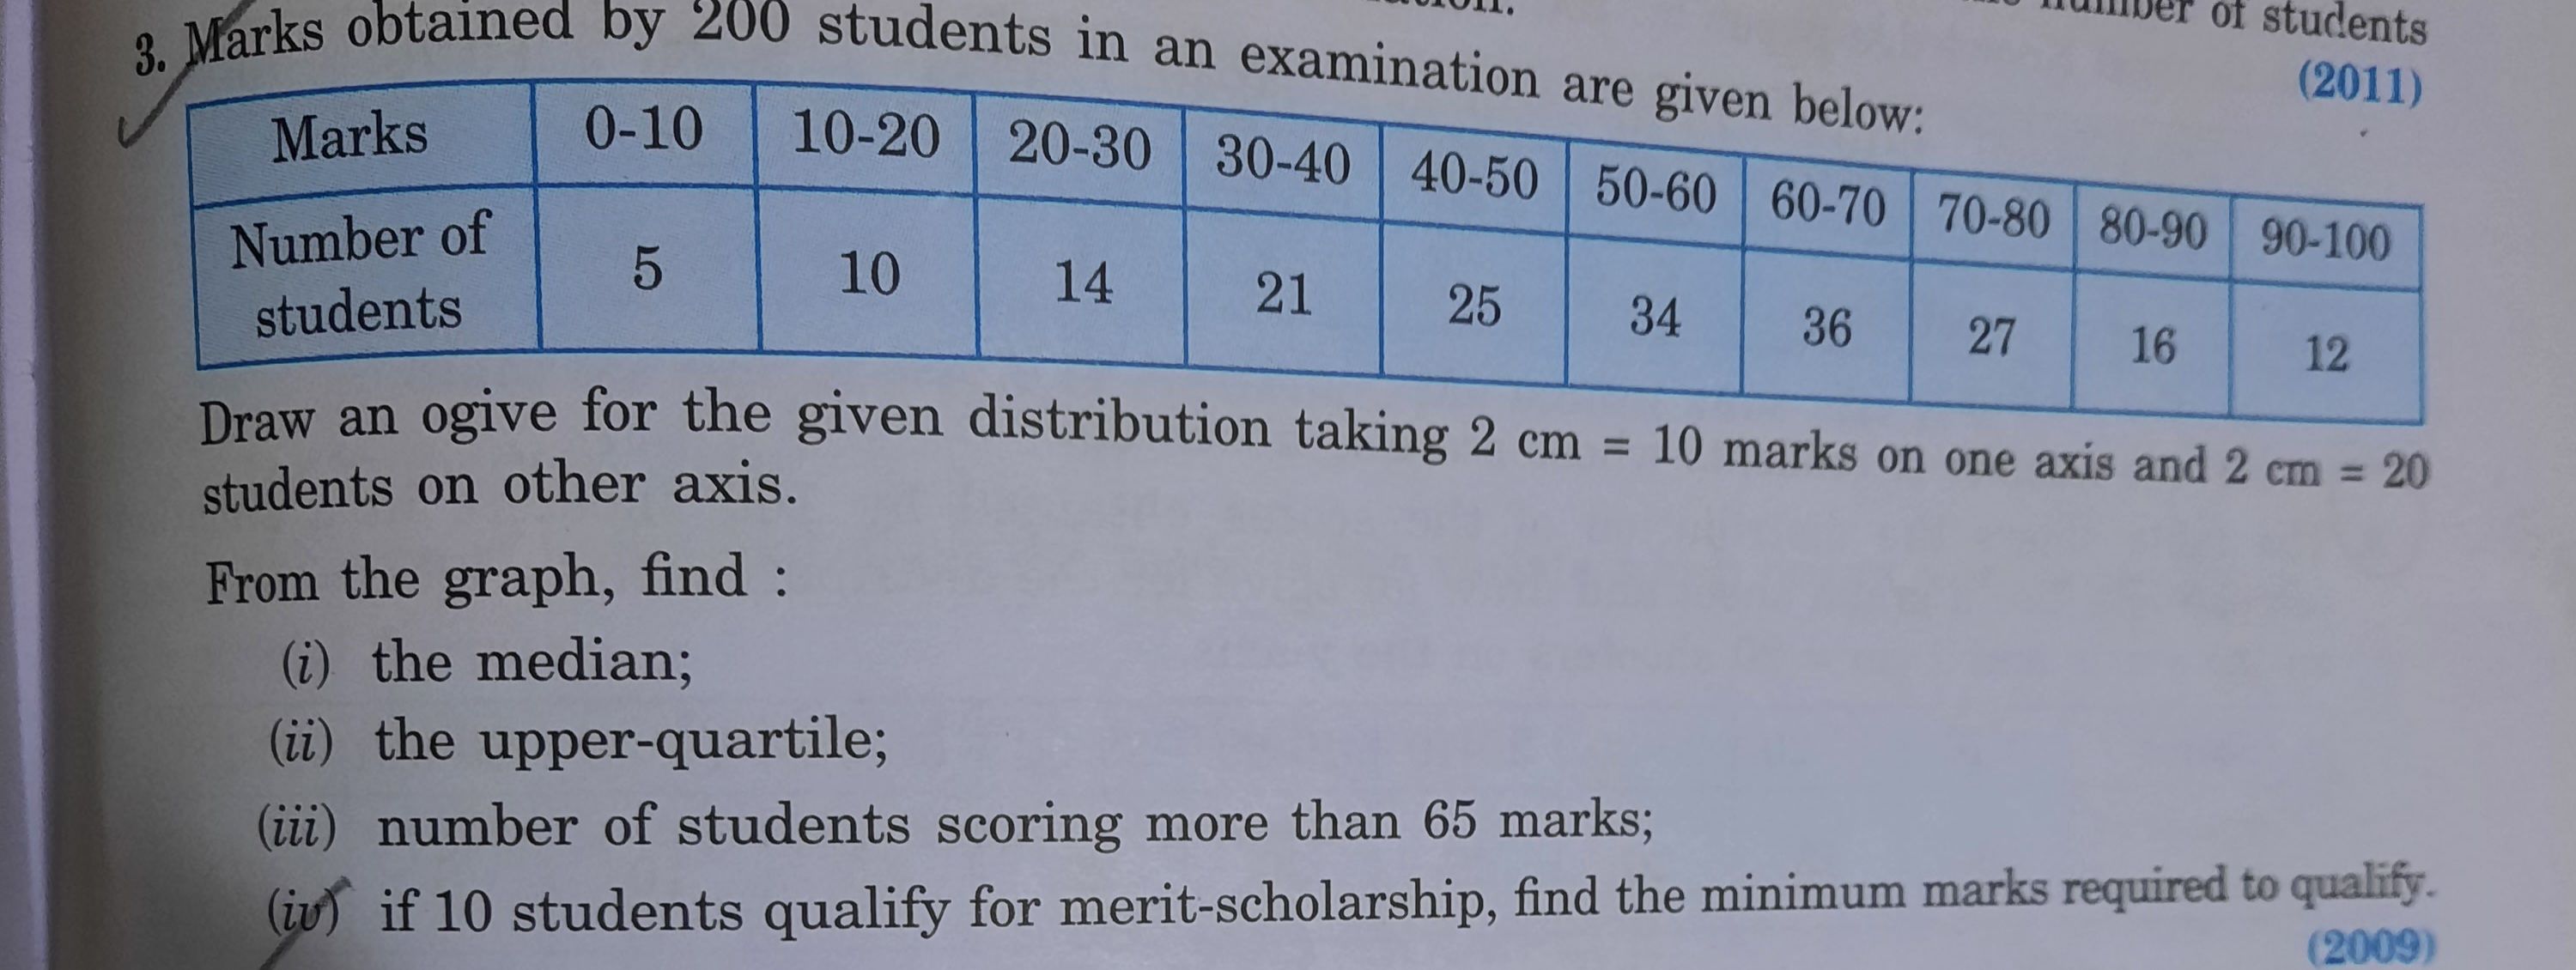
Let's prepare the frequency table first as shown below:
Marks Class marks(xi) No. of students Cumulative frequency
Frequency (f)
0-10 5 5 5
10-20 15 10 15
20-30 25 14 29
30-40 35 21 50
40-50 45 25 75
50-60 55 34 109
60-70 65 36 145
70-80 75 27 172
80-90 85 16 188
90-100 95 12 200
Upper limits will be plotted on x-axis and y-axis will have cumulative frequency
The points will be (10, 5), (20, 15), (30, 29), (40, 50), (50, 75), (60, 109), (70, 145), (80, 172), (90, 188), (100, 200)
Plot these points on the graph and join them with a smooth curve as shown:

Answered by Renu Varma | 26 Jun, 2022, 22:53: PM
Concept Videos
-
Statistics: Graphical Representation
 Statistics: Graphical Representation, Histogram and Ogive
ICSE 10 - Maths
Asked by rashikulkarni28 | 25 Jun, 2022, 18:44: PM
ICSE 10 - Maths
Asked by rashikulkarni28 | 25 Jun, 2022, 18:42: PM
ICSE 10 - Maths
Asked by rashikulkarni28 | 25 Jun, 2022, 18:40: PM
ICSE 10 - Maths
Asked by rashikulkarni28 | 25 Jun, 2022, 18:09: PM
