
CBSE Class 12-science Answered
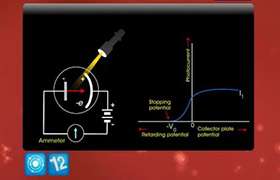
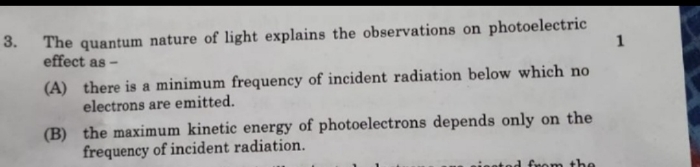
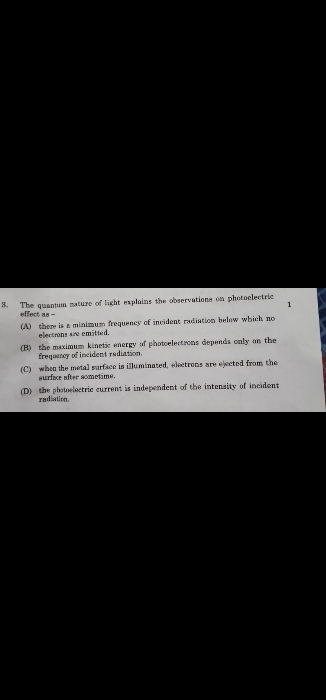
1. Draw the graphs showing the variation of photo-electric current with the change in anode potential of a photocell for the following conditions.
i) the same intensity but different frequencies
ii) the same frequency but different intensities.
i) the same intensity but different frequencies
ii) the same frequency but different intensities.
Asked by yeeshuraj3 | 18 Jan, 2017, 11:22: AM
(i) Same intensity different frequencies: The ggraph is as below

(ii) Same frequency different intensities: The ggraph is as below

Answered by Romal Bhansali | 19 Jan, 2017, 12:19: PM
Concept Videos
-
Photoelectric effect and Einstein's photoelectric equat ...
 This video is based on the study of Photoelectric effect and Einstein's pho...
 -
Dual Nature of Matter - Part 1
 This video explains the wave particle duality of matter
 -
About Photoelectric effects
 This video you will study about photoelectric effect and Einstein's photoel...
 -
Dual Nature of Matter - Part 2
 This video explains the Davisson Germer experiment and the Heisenberg's unc...
 -
Photoelectric Effect
 Study Photoelectric effect. Einstein's photoelectric equation.
CBSE 12-science - Physics
Asked by mishrigupta19319 | 08 Apr, 2024, 06:28: PM
CBSE 12-science - Physics
Asked by mishrigupta19319 | 07 Apr, 2024, 11:23: AM
CBSE 12-science - Physics
Asked by mazhartahsildar143 | 07 May, 2020, 01:44: PM
CBSE 12-science - Physics
Asked by Hemanthrakshitha95 | 03 Mar, 2020, 02:55: PM
CBSE 12-science - Physics
Asked by shivakumarshreyas24 | 01 Mar, 2020, 08:12: AM
CBSE 12-science - Physics
Asked by khushimassey437 | 31 May, 2019, 08:41: AM
CBSE 12-science - Physics
Asked by jain.pradeep | 26 May, 2019, 06:42: PM
CBSE 12-science - Physics
Asked by manasvijha | 19 Mar, 2019, 07:17: PM
CBSE 12-science - Physics
Asked by rohitraman1115 | 08 Jan, 2019, 04:33: PM
CBSE 12-science - Physics
Asked by Topperlearning User | 21 May, 2014, 09:18: AM
