
CBSE Class 9 - Distance Time Graphs Videos
Motion
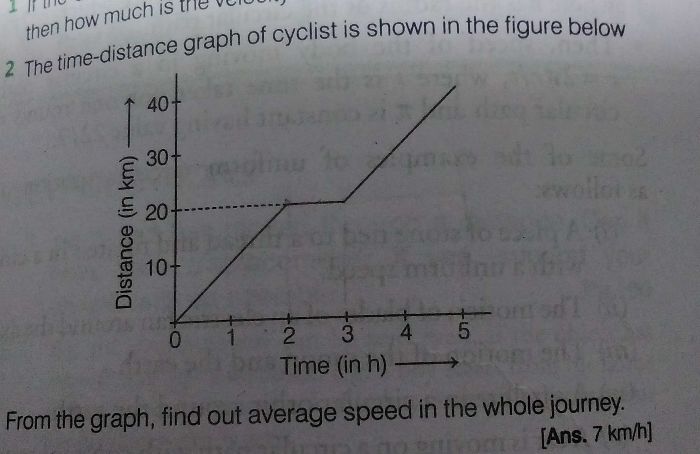
Interpret and calculate the slope of distance. Time graphs for a body in uniform and non-uniform motion.
More videos from this chapter
View All-
Motion

-
Motion
-
Motion

-
Laws of Motion

-
Motion
- car increases its velocity from 20 m per second to 40 m per second in 10 second find its acceleration?
-
Can't get the amswer
- what is slope
-
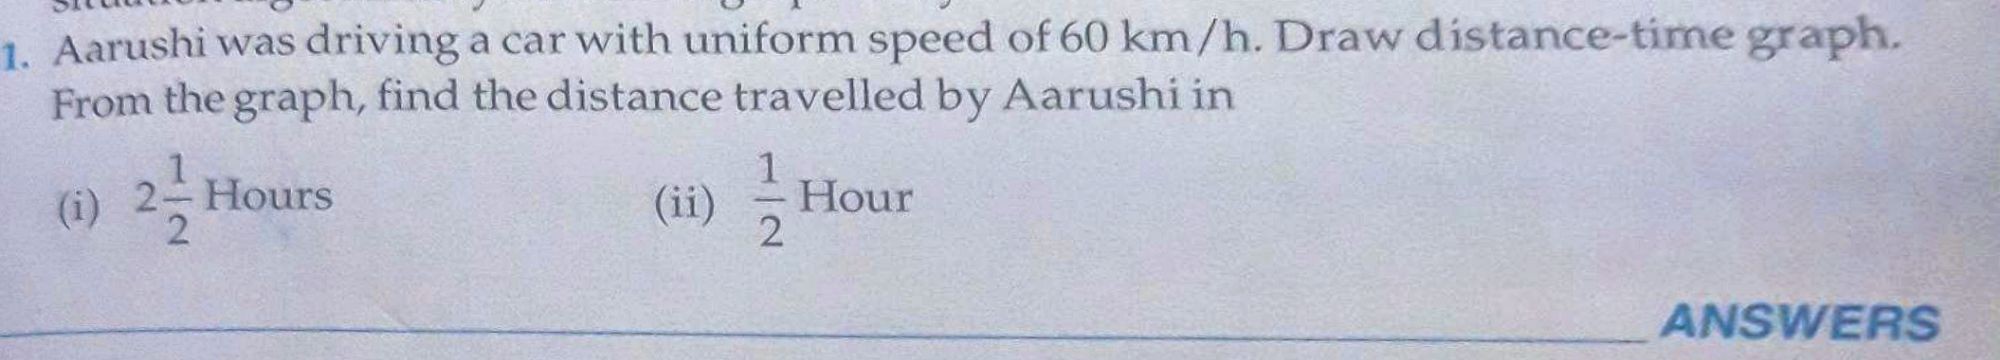
Aarushi was driving a car with uniform speed of 60km/h. Draw distance-time graph.From the graph, find the distance travelled by Aarushi in
(i) 221?hours
(ii) 21?hours
- what are not possible graphs for distance time
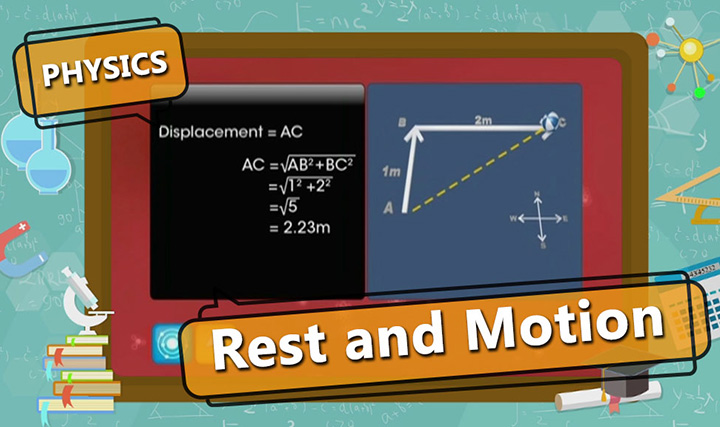
- An ant and a mosquito are at one of the vertices of cubical classroom having side length They have to reach ar diagonally opposite point of the eubidar dassroom. Find the displacement and minimum distance covered by both of them
- what is distance time
- what is velocity
- Using a spreadsheet, draw graph between distance and time, using the information about the movement of Amar, Akbar and Anthony given in the table on page 4,in the lesson on Law of Motion. What precautions will you take while drawing the graph
- Plot the points (2,3) (-2,3) (-2,-3) and (2,-3) on a graph sheet. Join these points. Name the figure obtained. Also, find the area of the figure so obtained.
