
CBSE Class 10 Answered
in an experiment to find the focal length of a concave mirror , a graph is drawn between the magnitudes of u and v ... what is the graph like??
URGENT
Asked by Paraukkhal | 26 Feb, 2011, 01:31: AM
Dear student,
Let 1/image distance = x and 1/object distance = y. and 1/ focal length = k
We know 1/image distance + 1/object distance = [1/ focal length ]
Hence
x +y = k
y = - x + k and the graph is straight line and hence the slope of this straight line is -1.
Comparing it with the equation of y = mx + c m = -1 and c = k.
We know 1/image distance + 1/object distance = [1/ focal length ]
Hence
x +y = k
y = - x + k and the graph is straight line and hence the slope of this straight line is -1.
Comparing it with the equation of y = mx + c m = -1 and c = k.
Hope this helps.
Team
Topperlearning.com
Answered by | 26 Feb, 2011, 07:15: AM
Application Videos
-
Formation of images by concave mirror ...
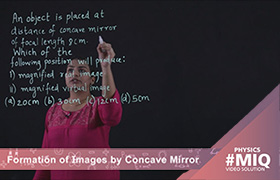 This video describes the calculation of position of images formed by a conc...
 -
Mirror formula
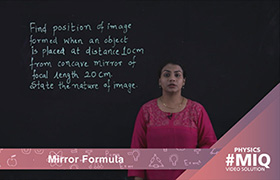 This video explains the application of mirror formula when an object is pla...
 -
Sign conventions for spherical mirrors ...
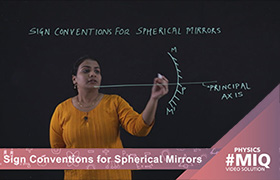 This video explains the concept of new cartesian sign conventions for spher...
 -
Formation of images in plane mirror
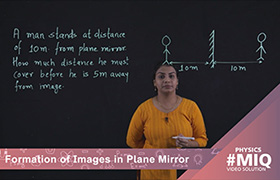 This video explains the application of characteristics of images formed by ...
 -
Speed calculation by plane mirror
 This video explains the calculation of speed of an image using the characte...
Concept Videos
-
Reflection of Light
 Reflection of light, laws/angle of reflection, real/virtual images and late...
 -
Reflection of Light
 Reflection of light, laws/angle of reflection, real/virtual images and late...
 -
Reflection of Light
 Explain refraction of light and define rarer/denser medium, refracted ray, ...
 -
Reflection of Light
 Define convex/concave mirror, pole, principal axis, radius/centre of curvat...
 -
Reflection of Light
 Define convex/concave mirror, pole, principal axis, radius/centre of curvat...
CBSE 10 - Physics
Asked by gs6070260 | 15 Jun, 2024, 20:45: PM
CBSE 10 - Physics
Asked by rv5238428 | 15 Jun, 2024, 19:43: PM
CBSE 10 - Physics
Asked by diljotsingh68641 | 08 Jun, 2024, 19:03: PM
CBSE 10 - Physics
Asked by jainvandan708 | 07 Jun, 2024, 12:06: PM
CBSE 10 - Physics
Asked by kk7629948076 | 03 Jun, 2024, 23:17: PM
CBSE 10 - Physics
Asked by agankitgupta938 | 18 Apr, 2024, 16:29: PM
CBSE 10 - Physics
Asked by infinityupgraded | 13 Apr, 2024, 08:17: AM
CBSE 10 - Physics
Asked by suryamr2019 | 08 Mar, 2024, 16:32: PM
CBSE 10 - Physics
Asked by saurabhjd527 | 30 Jan, 2024, 19:55: PM
