
ICSE Class 9 Answered
Draw ::
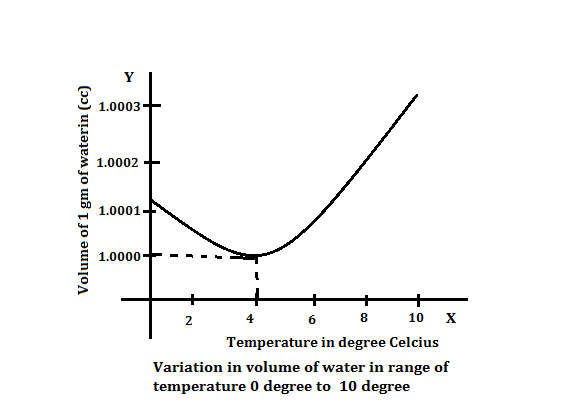
i) A temperature volume graph to show the change in volume when water is cooled from 10? to 0?
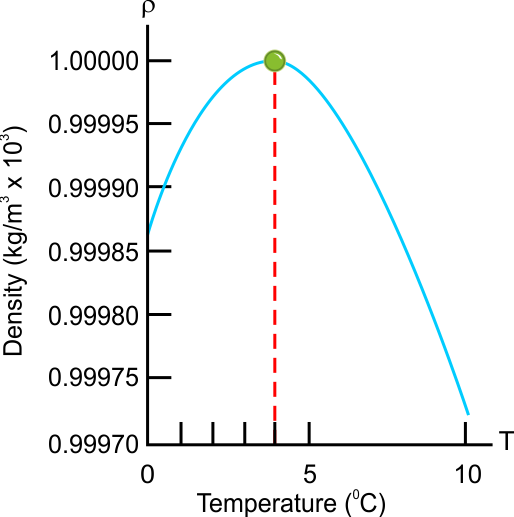
ii) A temperature density graph to show the change in density when water is cooled from 10? to 0?
Asked by kalpanasingh.ito | 29 Jan, 2020, 13:18: PM
i) A temperature volume graph to show the change in volume when water is cooled from 10℃ to 0℃
ii) A temperature density graph to show the change in density when water is cooled from 10℃ to 0℃
Answered by Shiwani Sawant | 29 Jan, 2020, 16:39: PM
Concept Videos
-
Heat and Energy
 Heat and Energy, Heat and Temperature; Anomalous Expansion
ICSE 9 - Physics
Asked by thesangeeta1990 | 08 Mar, 2024, 16:37: PM
ICSE 9 - Physics
Asked by lakshyarajsharma94 | 19 Dec, 2021, 12:37: PM
ICSE 9 - Physics
Asked by amit.clw4 | 03 Feb, 2021, 11:30: AM
ICSE 9 - Physics
Asked by kalpanasingh.ito | 29 Jan, 2020, 13:18: PM
ICSE 9 - Physics
Asked by kanchanrai9794870095 | 02 Dec, 2019, 21:32: PM
ICSE 9 - Physics
Asked by dishadistributorslko | 09 Oct, 2019, 23:53: PM
ICSE 9 - Physics
Asked by dharansingh36 | 24 Oct, 2018, 16:56: PM
