Class 9 FRANK Solutions Maths Chapter 22 - Statistics
Find out how to interpret data from a frequency table by practising TopperLearning’s Frank Solutions for ICSE Class 9 Mathematics Chapter 22 Statistics. Learn to determine class limits based on frequency distribution data. Revise textbook solutions on how to construct a cumulative frequency distribution table.
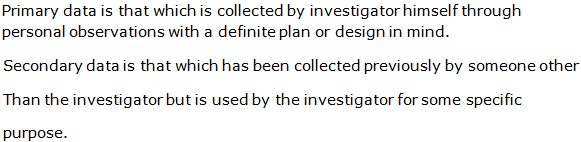
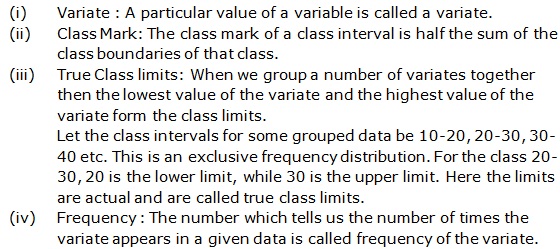
Study the definition of secondary data, primary data, frequency, variate, class mark, etc. with our Frank textbook solutions. There are ample e-learning resources other than textbook solutions available on our study portal. The learning materials like ICSE Class 9 Maths videos and online mock tests can be used to prepare well for your exam.
Statistics Exercise Ex. 22.1
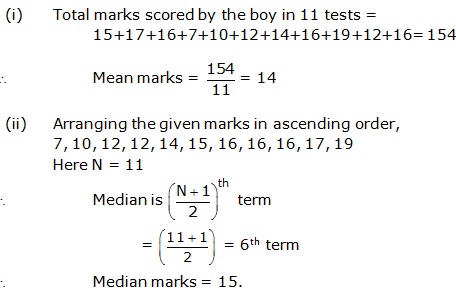
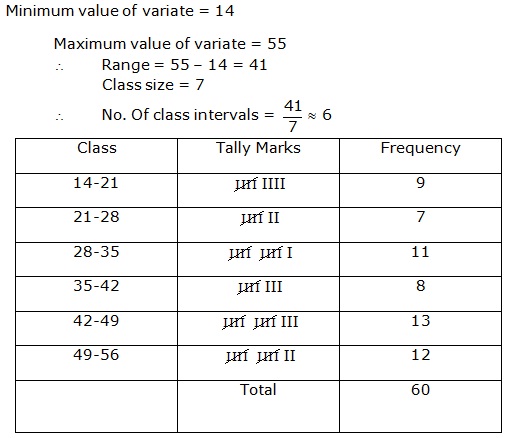
Solution 1
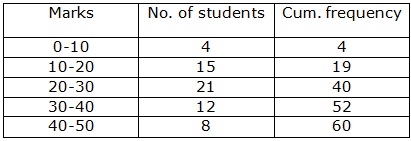
Solution 2
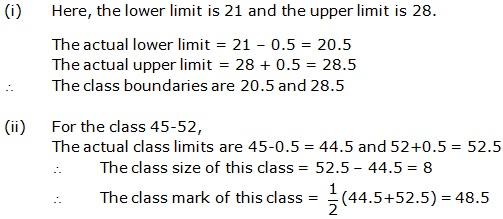
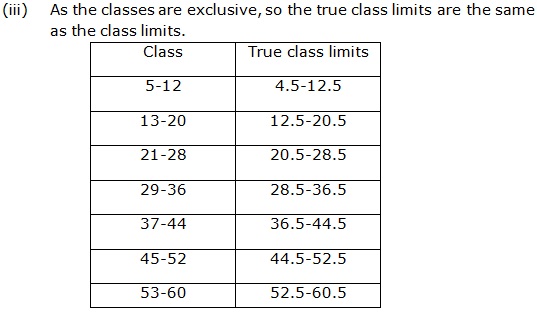
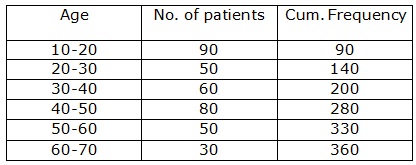
Solution 3
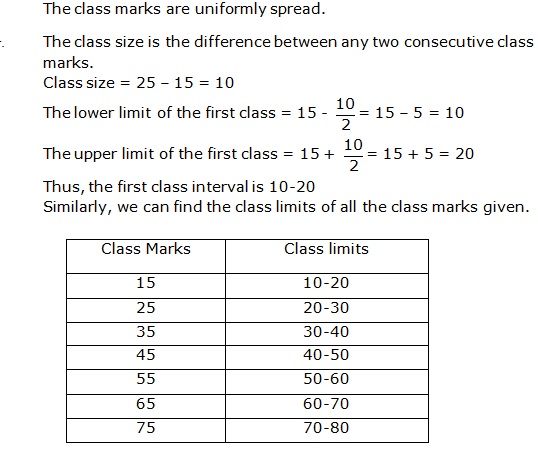
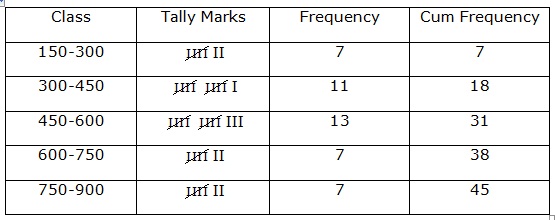
Solution 4
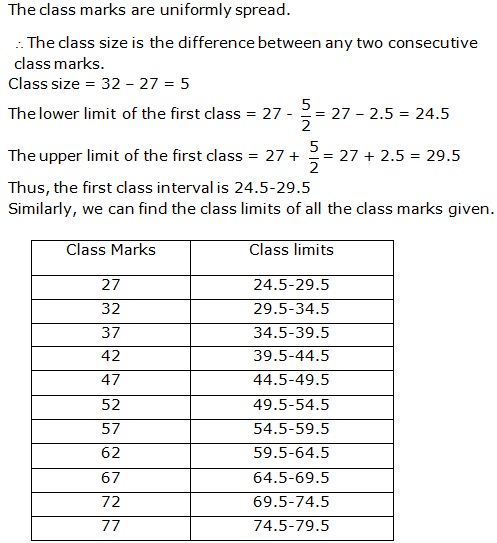
Solution 5
Solution 6

Solution 7

Solution 8
Solution 9
Solution 10
Solution 11
Solution 12
Statistics Exercise Ex. 22.2
Solution 1
Solution 2
Solution 3
Solution 4
Solution 5
Frequency distribution table is as follows:
|
Weight (in kg) |
c.f. |
|
25 - 30 |
110 (750 - 640) |
|
30 - 35 |
25 (640 - 615) |
|
35 - 40 |
130 (615 - 485) |
|
40 - 45 |
115 (485 - 370) |
|
45 - 50 |
150 (370 - 220) |
|
50 - 55 |
96 (220 - 124) |
|
55 - 60 |
75 (124 - 49) |
|
60 - 65 |
25 (49 - 25) |
|
65 - 70 |
24 (24 - 0) |
|
70 - 75 |
0 |
a. The number of students whose weight lie in the interval 40 - 45 is 115.
b. The interval 45 - 50 has the most number of students.
Statistics Exercise Ex. 22.3
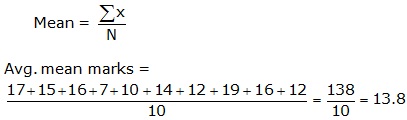
Solution 1
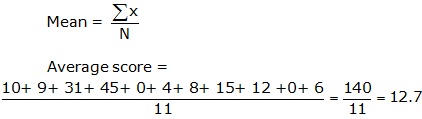
Solution 2
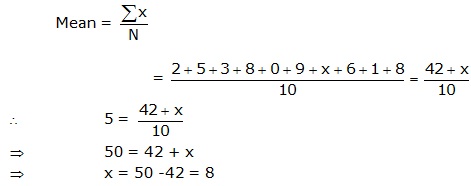
Solution 3
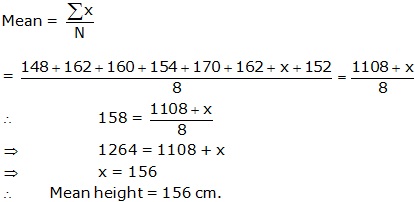
Solution 4
Solution 5
Solution 6

Solution 7
Solution 8
Solution 9
Solution 10
Solution 11
Solution 12

Solution 13

Solution 14

Solution 15

Solution 16
Solution 17
Solution 18
Solution 19

Solution 20