CBSE Class 6: Videos
More videos from this chapter
View All-
Pictographs

-
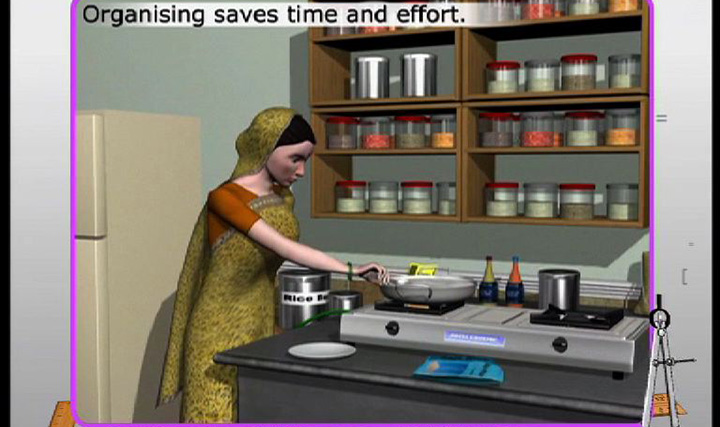
Organising and Representing data
-
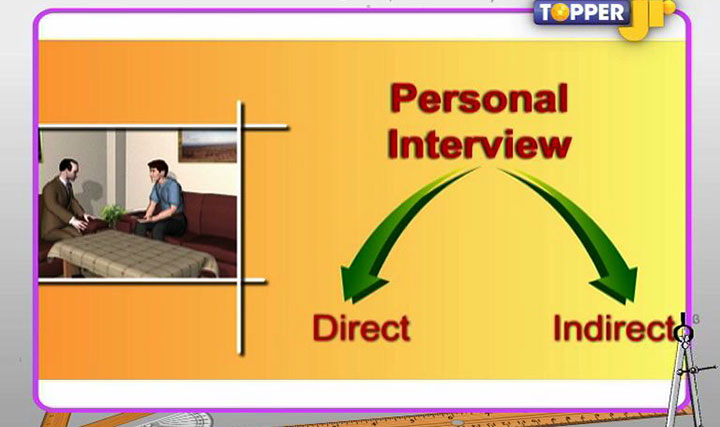
Collection and classification of data