
CBSE Class 6 Answered
The table represents the number of books sold in a store during four months of a year. Make a bar graph to represent the data.
Months
January
February
March
April
No. of books
140
120
110
130
Asked by Topperlearning User | 10 Jul, 2014, 12:34: PM
The bar graph is as shown below: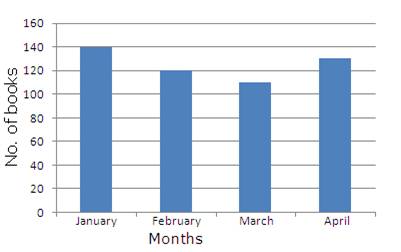
Answered by | 10 Jul, 2014, 14:34: PM
Concept Videos
CBSE 6 - Maths
Asked by kumar.rajendra072 | 15 Oct, 2020, 21:05: PM
CBSE 6 - Maths
Asked by mallicksanjoy667 | 26 Aug, 2020, 10:52: AM
CBSE 6 - Maths
Asked by Topperlearning User | 10 Jul, 2014, 12:34: PM
CBSE 6 - Maths
Asked by Topperlearning User | 04 Jun, 2014, 13:23: PM
CBSE 6 - Maths
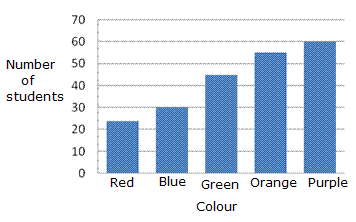 (a) How many students choose blue as their favorite colour?(b) How many more students choose green colour than red?
Asked by Topperlearning User | 21 May, 2015, 08:17: AM
CBSE 6 - Maths
Asked by Topperlearning User | 10 Jul, 2014, 12:33: PM
CBSE 6 - Maths
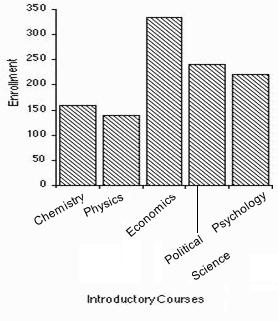 (a) Which course has the most students enrolled in it? (b) Order the courses by enrollment from lowest to highest.
Asked by Topperlearning User | 05 Mar, 2014, 11:11: AM
CBSE 6 - Maths
Asked by Topperlearning User | 06 Feb, 2014, 08:51: AM
CBSE 6 - Maths
Asked by Topperlearning User | 05 Mar, 2014, 11:12: AM
