
CBSE Class 9 Answered
what is speed time graph and what does the area under speed time graph of a moving body shows
Asked by amikha s | 13 Sep, 2012, 11:16: AM
A graph plotted between speed or velocity and time is called a speed-time graph.
The area under the speed-time graph gives the distance travelledby the body.
Answered by | 13 Sep, 2012, 11:55: AM
Application Videos
-
speed of body in uniform circular motion ...
 This video decribes the speed of a body in uniform circular motion.
 -
Distance and displacement_0
 This video describes the difference netween distance covered and displaceme...
 -
distance and displacement_2
 This video describes the displacement covered by a body during its journey.
 -
second equation of motion
 This video explains the relation between velocity and displacement
 -
first equation of motion ...
 This video describes the relation between velocity and acceleration
Concept Videos
-
Motion
 Define acceleration and retardation in context with uniform and non-unifor...
 -
Motion
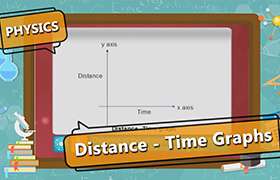 Interpret and calculate the slope of distance. Time graphs for a body in u...
 -
Motion
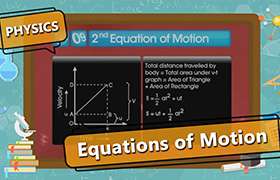 Derive and apply the three equations of motion using velocity-time graph f...
 -
Motion
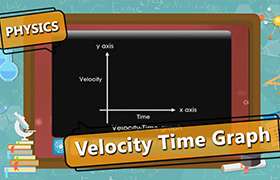 Interpret and calculate the slope of velocity. Time graphs for a body in u...
 -
Motion
 Define speed, velocity, average speed and average velocity in context with ...
CBSE 9 - Physics
Asked by mailtoparvathyprajith | 06 Feb, 2024, 09:50: PM
CBSE 9 - Physics
Asked by mailtoparvathyprajith | 06 Feb, 2024, 09:10: PM
CBSE 9 - Physics
Asked by sapnamantri05 | 24 Nov, 2023, 04:54: PM
CBSE 9 - Physics
Asked by ashrithpandu84 | 09 Oct, 2023, 08:09: PM
CBSE 9 - Physics
Asked by janhavisoni2099 | 02 Oct, 2023, 05:20: PM
CBSE 9 - Physics
Asked by durgesh21332 | 06 Sep, 2023, 06:17: PM
CBSE 9 - Physics
Asked by sagrawal0081 | 18 Aug, 2023, 05:04: PM
CBSE 9 - Physics
Asked by ketkiparasgandhi | 05 Jul, 2023, 08:02: PM
CBSE 9 - Physics
Asked by leena3732 | 15 Jun, 2023, 09:42: AM
