CBSE Class 10 Answered
The following distribution gives the daily income of 50workers of factory
daily income 200-250 250-300 300-350 350-400 400-450 450-500
no.of workers 10 5 11 8 6 10
Convert the distribution to a less than type cumilative frequency distribution and draw its ogive.
hence obtain the median daily income.
Asked by banu.maths12 | 28 Sep, 2019, 18:57: PM
For the median of grouped data, Cumumlative frequecy curve (less than type) and ogive. Please watch the below videos.
Answered by Yasmeen Khan | 04 Oct, 2019, 15:12: PM
Application Videos
-
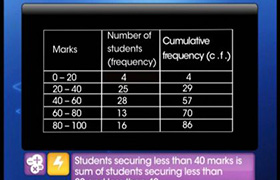
Median of Grouped data

The video explains that how to find the median of grouped data
-
Median of Grouped Data
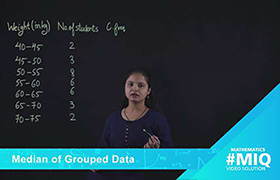
This videos explains the concept of Mean of a Continuous Frequency Distr...
-
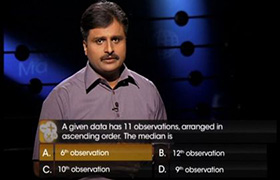
Median of Ungrouped Data
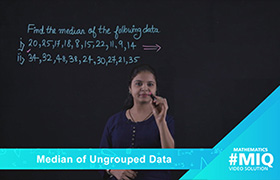 Method of finding Median of the given data, when the numbers the number of ...
Concept Videos
-
Median of raw data odd, even no.
 This video covers an application on median of raw data odd, even no.
 -
Median of continuous data
 This video covers an application on median of continuous data
 -
Median of grouped data
 This video explains how to find median of grouped data and solves some exam...
 -
More concepts related to median of grouped data
 This video discussed about median of grouped data and helps visualising the...
 -
About median of grouped data
 This video is based on median of grouped data.
CBSE 10 - Maths
Asked by bushrafatima6892 | 20 Apr, 2022, 04:02: AM
CBSE 10 - Maths
Asked by anuj05.slg | 07 Nov, 2020, 11:46: AM
CBSE 10 - Maths
Asked by srijapinky25 | 21 Jun, 2020, 13:58: PM
CBSE 10 - Maths
Asked by shellyjafri | 27 Apr, 2020, 13:17: PM
CBSE 10 - Maths
Asked by diya123451 | 24 Mar, 2020, 13:41: PM
CBSE 10 - Maths
Asked by diya123451 | 24 Mar, 2020, 09:16: AM
CBSE 10 - Maths
Asked by banu.maths12 | 28 Sep, 2019, 18:57: PM
CBSE 10 - Maths
Asked by bleelakrishna2003 | 07 Feb, 2019, 18:56: PM