
CBSE Class 8 Answered
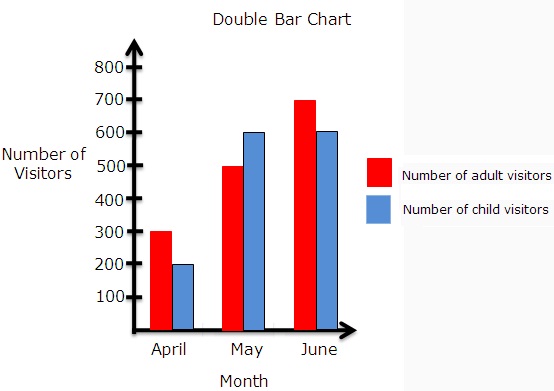
The following data shows the number of adult visitors and child visitors to a park. Construct a double bar graph for the given data.
Month
April
May
June
Number of adult visitors
300
500
700
Number of child visitors
200
600
600
Asked by Topperlearning User | 04 Jun, 2014, 13:23: PM
Represent the months on the x-axis and the number of visitors on the y-axis.
The double bar graph is as follows:
Answered by | 04 Jun, 2014, 15:23: PM
Concept Videos
-
Bar Graphs and Histograms
 bar graph, histogram their interpretation,comparison of the two
CBSE 8 - Maths
Asked by Topperlearning User | 04 Jun, 2014, 13:23: PM
CBSE 8 - Maths
Asked by Topperlearning User | 04 Jun, 2014, 13:23: PM
CBSE 8 - Maths

Asked by Topperlearning User | 04 Jun, 2014, 13:23: PM
CBSE 8 - Maths
Asked by Topperlearning User | 04 Jun, 2014, 13:23: PM
CBSE 8 - Maths
Asked by Topperlearning User | 04 Jun, 2014, 13:23: PM
CBSE 8 - Maths
 Use the histogram to answer each of the following question.
a. Which outcome happened the most times?
b. How many times did this outcome discussed in part a happen?
c. How many rolls had a total of less than 6 points?
d. How many rolls had a total of 10 or more points?
Use the histogram to answer each of the following question.
a. Which outcome happened the most times?
b. How many times did this outcome discussed in part a happen?
c. How many rolls had a total of less than 6 points?
d. How many rolls had a total of 10 or more points?Asked by Topperlearning User | 04 Jun, 2014, 13:23: PM
CBSE 8 - Maths
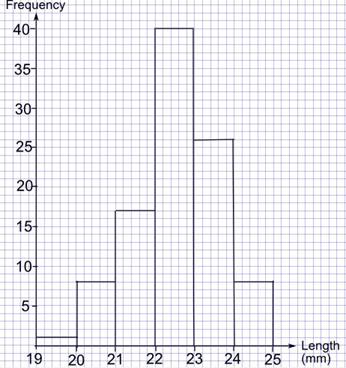 1) How many eggs were measured altogether in the experiment?
2) How many eggs were less than or equal to 23 mm in length?
1) How many eggs were measured altogether in the experiment?
2) How many eggs were less than or equal to 23 mm in length?Asked by Topperlearning User | 04 Jun, 2014, 13:23: PM
CBSE 8 - Maths
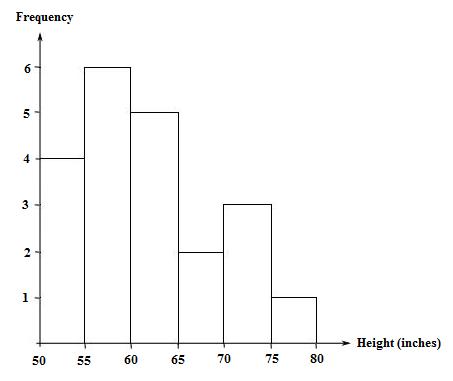 The histogram shows the heights of 21 students in a class. The height of how many students were greater than or equal to 55 inches but less than 70 inches?
Asked by Topperlearning User | 08 Apr, 2013, 02:17: AM
CBSE 8 - Maths
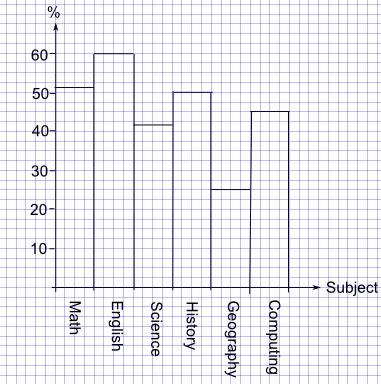 The bar graph shows the marks Brett obtained in his end of year exams. i) How many more percentage points did Brett score in his best subject than in his worst subject?
ii) Brett's friend, Luke, scored 12 percentage points higher than Brett in Science. What was Luke's marks for Science?
The bar graph shows the marks Brett obtained in his end of year exams. i) How many more percentage points did Brett score in his best subject than in his worst subject?
ii) Brett's friend, Luke, scored 12 percentage points higher than Brett in Science. What was Luke's marks for Science?Asked by Topperlearning User | 08 Apr, 2013, 02:14: AM
CBSE 8 - Maths
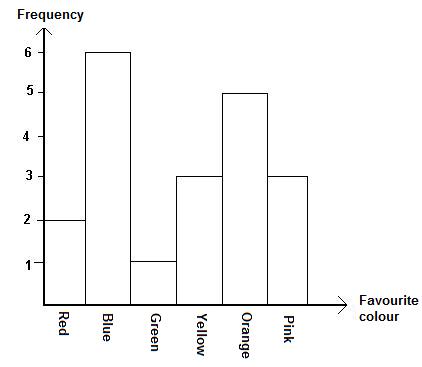 The given bar graph shows the favourite colours of 20 students in a class. How many more students favour orange colour than green?
Asked by Topperlearning User | 08 Apr, 2013, 02:08: AM
