
CBSE Class 8 Answered
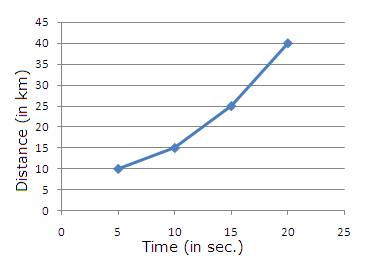
The following data shows the journey of a remote car:
Time (in sec.)
5
10
15
20
Distance (in km)
10
15
25
40
Represent this data in a graph.
Asked by Topperlearning User | 04 Jun, 2014, 01:23: PM
The data can be represented in a graph as shown below:
Answered by | 04 Jun, 2014, 03:23: PM
Concept Videos
-
Plotting Linear Graphs
 Dependent and independent variables, drawing the linear graphs and solved p...
CBSE 8 - Maths
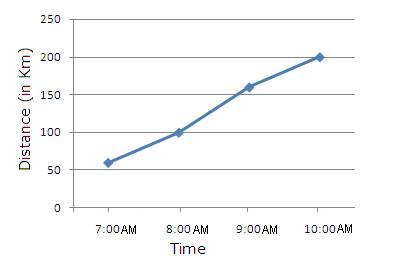 Study the graph and find:
(a) Distance covered till 8:00 AM.
(b) Total distance covered by the car.
Study the graph and find:
(a) Distance covered till 8:00 AM.
(b) Total distance covered by the car.Asked by Topperlearning User | 12 Dec, 2013, 02:41: AM
CBSE 8 - Maths
Asked by Topperlearning User | 04 Jun, 2014, 01:23: PM
CBSE 8 - Maths
Asked by Topperlearning User | 04 Jun, 2014, 01:23: PM
CBSE 8 - Maths
Asked by Topperlearning User | 04 Jun, 2014, 01:23: PM
CBSE 8 - Maths
Asked by Topperlearning User | 04 Jun, 2014, 01:23: PM
CBSE 8 - Maths
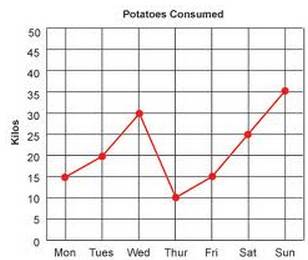 Read the graph and answer the following questions.
(a) On which day did maximum amount of potatoes consumed?(b) On which day the consumption of potatoes went down?(c) What is the combine consumption of potatoes on Monday, Tuesday and Wednesday?
Read the graph and answer the following questions.
(a) On which day did maximum amount of potatoes consumed?(b) On which day the consumption of potatoes went down?(c) What is the combine consumption of potatoes on Monday, Tuesday and Wednesday?Asked by Topperlearning User | 12 Dec, 2013, 03:03: AM
CBSE 8 - Maths
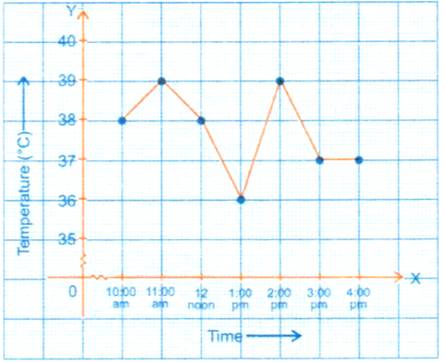 Read it carefully and answer the following questions:
(a) What is the temperature of the patient at 12 noon?
(b) At what time is the temperature of the patient minimum?
(c) At what time the temperature of the patient remains same?
Read it carefully and answer the following questions:
(a) What is the temperature of the patient at 12 noon?
(b) At what time is the temperature of the patient minimum?
(c) At what time the temperature of the patient remains same?Asked by Topperlearning User | 04 Jun, 2014, 01:23: PM
CBSE 8 - Maths
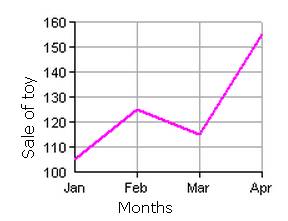 (a) The difference of sale in the month of February and March.
(b) Total sale in four months.
(a) The difference of sale in the month of February and March.
(b) Total sale in four months.Asked by Topperlearning User | 04 Jun, 2014, 01:23: PM
CBSE 8 - Maths
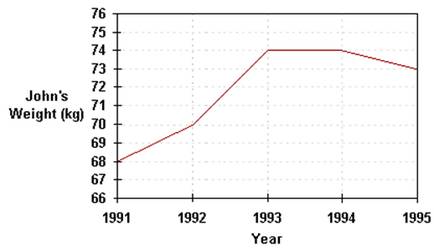 (a) Find the increase in John's weight from 1991 to 1995.
(b) Find John's weight in the year 1993.
(a) Find the increase in John's weight from 1991 to 1995.
(b) Find John's weight in the year 1993.Asked by Topperlearning User | 12 Dec, 2013, 11:04: PM
CBSE 8 - Maths
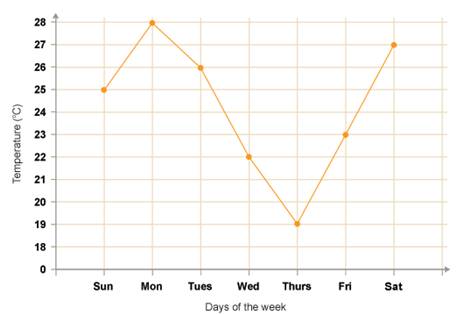 (a) Which was the coldest day and what was the temperature on that day?
(b) What was the temperature on Monday?
(c) On which day the temperature was 26oC?
(a) Which was the coldest day and what was the temperature on that day?
(b) What was the temperature on Monday?
(c) On which day the temperature was 26oC?Asked by Topperlearning User | 12 Dec, 2013, 01:50: AM
