CBSE Class 10 Answered
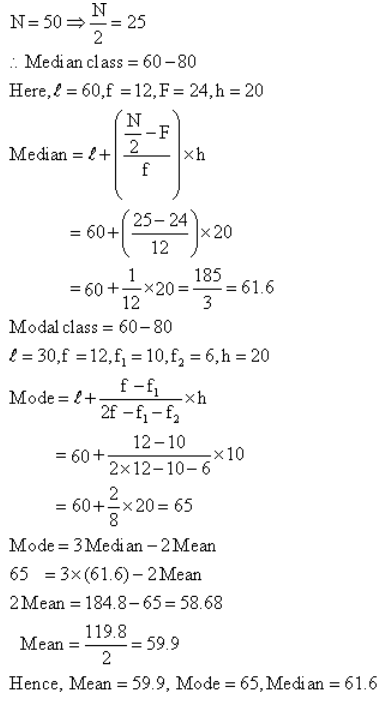
Find the mean, median and mode of the following data:
Classes
Frequency
0 - 20
6
20 – 40
8
40 – 60
10
60 – 80
12
80 – 100
6
100 – 120
5
120 - 140
3
Asked by Topperlearning User | 13 Feb, 2014, 13:13: PM
|
Classes
|
Frequency
|
Cumulative Frequency
|
|
0 - 20
|
6
|
6
|
|
20 – 40
|
8
|
14
|
|
40 – 60
|
10
|
24
|
|
60 – 80
|
12
|
36
|
|
80 – 100
|
6
|
42
|
|
100 – 120
|
5
|
47
|
|
120 - 140
|
3
|
50
|

Answered by | 13 Feb, 2014, 15:13: PM
Application Videos
Concept Videos
CBSE 10 - Maths
Asked by tanya78904321 | 24 Sep, 2023, 19:12: PM
CBSE 10 - Maths
Asked by lisajameson338 | 25 Jan, 2023, 09:03: AM
CBSE 10 - Maths
Asked by nandinisingh030206 | 25 Mar, 2021, 15:33: PM
CBSE 10 - Maths
Asked by rusuishika | 28 May, 2020, 18:22: PM
CBSE 10 - Maths
Asked by ashadsaiyad7 | 12 May, 2020, 19:39: PM
CBSE 10 - Maths
Asked by karanbora625 | 23 Apr, 2020, 17:30: PM
CBSE 10 - Maths
Asked by Lovely7835039 | 24 Jul, 2019, 04:30: AM
CBSE 10 - Maths
Asked by Topperlearning User | 12 Feb, 2014, 14:16: PM
CBSE 10 - Maths
Asked by Topperlearning User | 27 Jul, 2017, 16:17: PM
CBSE 10 - Maths
Asked by Topperlearning User | 13 Feb, 2014, 13:13: PM


