
CBSE Class 10 Answered
A survey regarding the heights (in cm) of 50 girls of class X of a school was conducted and the following data was obtained:
Height (in cm)
120 - 130
130 - 140
140 - 150
150 – 160
160 – 170
Total
Number of girls
2
8
12
20
8
50
Find the mean, median and mode of the above data.
Asked by Topperlearning User | 12 Feb, 2014, 14:16: PM
|
Height in cm
|
Number of girls
|
Cumulative Frequency
|
|
120 – 130
|
2
|
2
|
|
130 – 140
|
8
|
10
|
|
140 – 150
|
12
|
22
|
|
150 – 160
|
20
|
42
|
|
160 – 170
|
8
|
50
|
|
Total
|
50
|
|
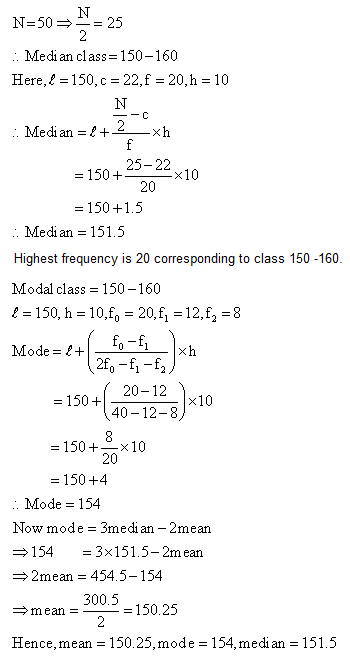
Answered by | 12 Feb, 2014, 16:16: PM
Application Videos
-
Relation between Mean, median and mode
This video explains a case study question based on the relation between ...
-
Relation between central tendencies
This video explains a case study based question on the concept of Statis...
-
Relation between Mean, Median and Mode ...
 This videos the relationship between Mean, Median and Mode.
Concept Videos
-
Relation Between Central Tendencies: Exam Prep Strategi ...
 Study most frequently used measure of central tendency i.e mean. Symmetrica...
 -
Measure of central tendency concepts ...
 This video explains measure of central tendency.
 -
Relation Between Central Tendencies
 This video explains the most frequently used measure of central tendency i....
CBSE 10 - Maths
Asked by tanya78904321 | 24 Sep, 2023, 19:12: PM
CBSE 10 - Maths
Asked by lisajameson338 | 25 Jan, 2023, 09:03: AM
CBSE 10 - Maths
Asked by nandinisingh030206 | 25 Mar, 2021, 15:33: PM
CBSE 10 - Maths
Asked by rusuishika | 28 May, 2020, 18:22: PM
CBSE 10 - Maths
Asked by ashadsaiyad7 | 12 May, 2020, 19:39: PM
CBSE 10 - Maths
Asked by karanbora625 | 23 Apr, 2020, 17:30: PM
CBSE 10 - Maths
Asked by Lovely7835039 | 24 Jul, 2019, 04:30: AM
CBSE 10 - Maths
Asked by Topperlearning User | 12 Feb, 2014, 14:16: PM
CBSE 10 - Maths
Asked by Topperlearning User | 27 Jul, 2017, 16:17: PM
CBSE 10 - Maths
Asked by Topperlearning User | 13 Feb, 2014, 13:13: PM
