
CBSE Class 12-science Answered
Draw a graph indicating the variation of resistivity of a semiconductor with
temperature
Asked by Ramvikassv | 14 May, 2021, 23:14: PM
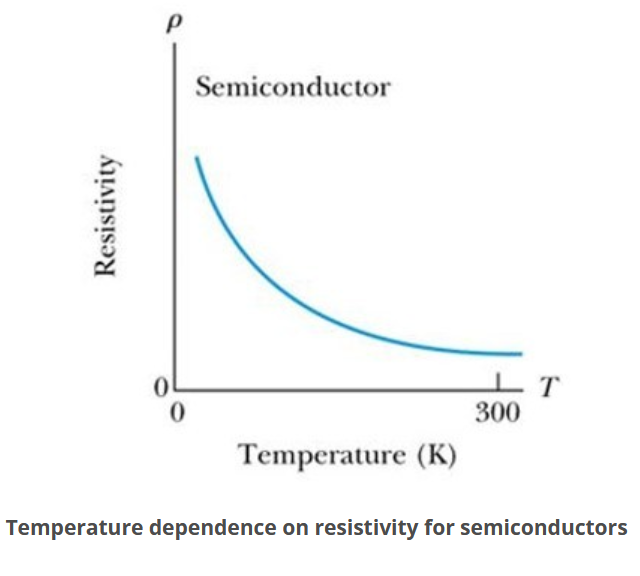
The resistivity of a semiconductor decreases with temperature. This is because of increasing temperature,
the electrons in the valence band gain sufficient thermal energies to jump to the conduction band.
As the number of electrons in the conduction band increases, so conductivity increases and resistivity decreases.
Answered by Thiyagarajan K | 15 May, 2021, 00:53: AM
CBSE 12-science - Physics
Asked by Abhishek | 23 Mar, 2023, 20:37: PM
CBSE 12-science - Physics
Asked by Ramvikassv | 14 May, 2021, 23:14: PM
CBSE 12-science - Physics
Asked by Topperlearning User | 04 Jun, 2014, 13:23: PM
CBSE 12-science - Physics
Asked by Topperlearning User | 04 Jun, 2014, 13:23: PM
CBSE 12-science - Physics
Asked by Topperlearning User | 04 Jun, 2014, 13:23: PM
CBSE 12-science - Physics
Asked by Topperlearning User | 17 Jun, 2014, 15:32: PM
CBSE 12-science - Physics
Asked by Topperlearning User | 04 Jun, 2014, 13:23: PM
CBSE 12-science - Physics
Asked by Topperlearning User | 04 Jun, 2014, 13:23: PM
CBSE 12-science - Physics
Asked by Topperlearning User | 04 Jun, 2014, 13:23: PM
CBSE 12-science - Physics
Asked by Topperlearning User | 04 Jun, 2014, 13:23: PM
