Class 9 SELINA Solutions Maths Chapter 18: Statistics
Statistics Exercise Ex. 18
Solution 1(a)
Correct option: (ii) sizes of shoes
A variable that takes distinct, countable values is called a discrete variable.
Size of shoes can be 4, 5, ….. and so on but cannot take any value between 4 and 5, 5 and 6, and so on.
Solution 1(b)
Correct option: (ii) 54
Maximum value = 90
Minimum value = 36
Therefore, range = maximum value - minimum value = 90 - 36 = 54
Solution 1(c)
Correct option: (iii) 40
![]()
Solution 1(d)
Correct option: (iv) 10.5-20.5
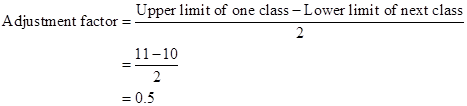
Therefore, the class
11-20 after adjustment is ![]()
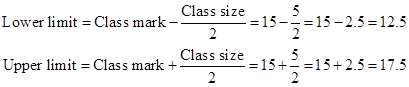
Solution 1(e)
Correct option: (i) 12.5-17.5
Class size = 15 - 10 = 5
Solution 2
(a)Discrete variable.
(b)Continuous variable.
(c)Discrete variable.
(d)Continuous variable.
(e)Discrete variable.
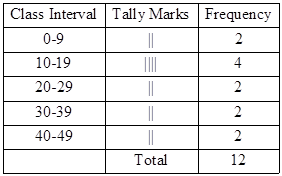
Solution 3
The frequency table for the given distribution is
|
Marks |
Tally Marks |
Frequency |
|
|
|
|
|
|
|
|
|
|
|
|
|
|
|
|
|
|
|
|
Solution 4
The frequency table for the given distribution is
|
Marks |
Tally Marks |
Frequency |
|
|
|
|
|
|
|
|
|
|
|
|
|
|
|
|
|
|
|
|


In this frequency distribution, the marks 30 are in the class of interval 30 - 40 and not in 20 - 30. Similarly, marks 40 are in the class of interval 40 - 50 and not in 30 - 40.
Solution 5
(a)Variable.
(b)Discrete variables.
(c)Continuous variable.
(d)The range is ![]()
(e)Lower limit is ![]() and upper limit is
and upper limit is ![]()
(f)The class mark is ![]()
![]()
Solution 6
In case of frequency 10 - 19 the lower class limit is 10, upper class limit is 19 and mid-value is 
In case of frequency 20 - 29 the lower class limit is 20, upper class limit is 29 and mid-value is 
In case of frequency 30 - 39 the lower class limit is 30, upper class limit is 39 and mid-value is 
In case of frequency 40 - 49 the lower class limit is 40, upper class limit is 49 and mid-value is 
Solution 7
In case of frequency 1.1 - 2.0 the lower class limit is 1.1, upper class limit is 2.0 and class mark
is 
In case of frequency 2.1 - 3.0 the lower class limit is 2.1, upper class limit is 3.0 and class mark
is 
In case of frequency 3.1 - 4.0 the lower class limit is 3.1, upper class limit is 4.0 and class mark
is 
Solution 8
(a)
The actual class limit of the fourth class will be:
44.5-49.5.
(b)
The class boundaries of the sixth class will be:
54.5-59.5
(c)
The class mark of the third class will be the average of the lower bound and the upper bound of the interval. Therefore class mark will be:

(d)
The upper and lower limit of the fifth class is 54 and 50 respectively.
(e)
The size of the third class will be: 44 - 40 + 1 =5.
Solution 9
(i)The cumulative frequency distribution table is
|
C.I |
c.f |
|
|
|
(ii)The cumulative frequency distribution table is
|
C.I |
c.f |
|
|
|
Solution 10
(i)The frequency distribution table is
|
C.I |
c.f |
|
|
|
(ii)The frequency distribution table is
|
C.I |
c.f |
|
|
|
Solution 11
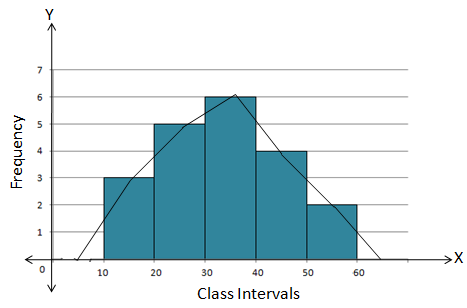
The frequency polygon is shown in the following figure
Steps:
(i)Drawing a histogram for the given data.
(ii)Marking the mid-point at the top of each rectangle of the histogram drawn.
(iii)Also, marking mid-point of the immediately lower class-interval and mid-point of the immediately higher class-interval.
(iv)Joining the consecutive mid-points marked by straight lines to obtain the required frequency polygon.
Solution 12
Steps:
- Draw a histogram for the given data.
- Mark the mid-point at the top of each rectangle of the histogram drawn.
- Also, mark the mid-point of the immediately lower class-interval and mid-point of the immediately higher class-interval.
- Join the consecutive mid-points marked by straight lines to obtain the required frequency polygon.
The required combined histogram and frequency polygon is shown in the following figure:
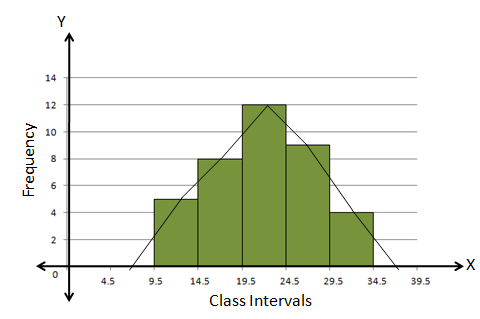
Solution 13
The class intervals are inclusive. We will first convert them into the exclusive form.
|
Class-Interval |
Frequency |
|
9.5 - 14.5 |
5 |
|
14.5 - 19.5 |
8 |
|
19.5 - 24.5 |
12 |
|
24.5 - 29.5 |
9 |
|
29.5 - 34.5 |
4 |
Steps:
- Draw a histogram for the given data.
- Mark the mid-point at the top of each rectangle of the histogram drawn.
- Also, mark the mid-point of the immediately lower class-interval and mid-point of the immediately higher class-interval.
- Join the consecutive mid-points marked by straight lines to obtain the required frequency polygon.
The required frequency polygon is as follows:
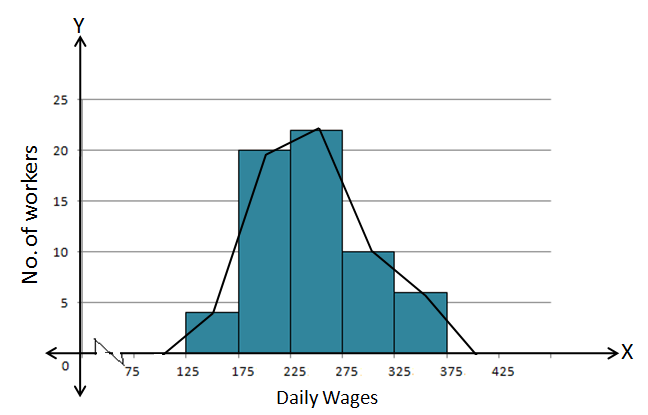
Solution 14
Steps:
- Draw a histogram for the given data.
- Mark the mid-point at the top of each rectangle of the histogram drawn.
- Also, mark the mid-point of the immediately lower class-interval and mid-point of the immediately higher class-interval.
- Join the consecutive mid-points marked by straight lines to obtain the required frequency polygon.
The required frequency polygon is as follows:
Statistics Exercise Test Yourself
Solution 1
The frequency table is
|
C.I |
c.f |
|
|
|
Solution 2
The frequency distribution table is
|
C.I |
c.f |
|
|
|
(i)The number of students in the age group ![]() is
is ![]()
(ii)The age group which has the least number of students is ![]()
Solution 3
|
Class Interval |
Frequency |
Cumulative Frequency |
|
65-74
|
|
|

Solution 4
|
X
|
0
|
1
|
2
|
3
|
4
|
5
|
6
|
7
|
8
|
9
|
|
F
|
2
|
5
|
5
|
8
|
4
|
5
|
4
|
4
|
5
|
8
|
Most occurring digits are 3 and 9. Least occurring digits are 0.
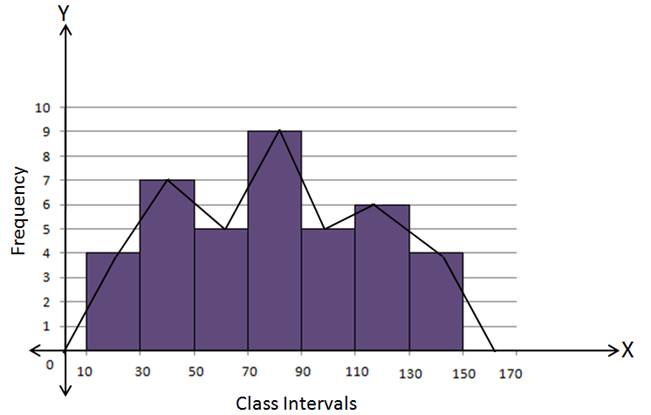
Solution 5(i)
(a) Using Histogram:
|
C.I. |
f |
|
10 - 30 |
4 |
|
30 - 50 |
7 |
|
50 - 70 |
5 |
|
70 - 90 |
9 |
|
90 - 110 |
5 |
|
110 - 130 |
6 |
|
130 - 150 |
4 |
Steps:
- Draw a histogram for the given data.
- Mark the mid-point at the top of each rectangle of the histogram drawn.
- Also, mark the mid-point of the immediately lower class-interval and mid-point of the immediately higher class-interval.
- Join the consecutive mid-points marked by straight lines to obtain the required frequency polygon.
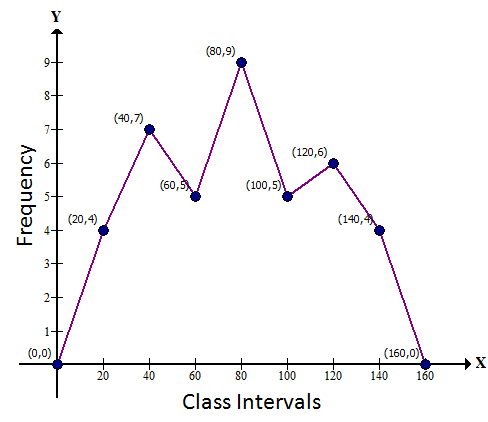
(b) Without using Histogram:
Steps:
-
Find the class-mark (mid-value) of each given class-interval.

- On a graph paper, mark class-marks along X-axis and frequencies along Y-axis.
-
On this graph paper, mark points taking values of class-marks along X-axis and the values of their corresponding frequencies along Y-axis.
- Draw line segments joining the consecutive points marked in step (3) above.
|
C.I. |
Class-mark |
f |
|
-10 - 10 |
0 |
0 |
|
10 - 30 |
20 |
4 |
|
30 - 50 |
40 |
7 |
|
50 - 70 |
60 |
5 |
|
70 - 90 |
80 |
9 |
|
90 - 110 |
100 |
5 |
|
110 - 130 |
120 |
6 |
|
130 - 150 |
140 |
4 |
|
150 - 170 |
160 |
0 |
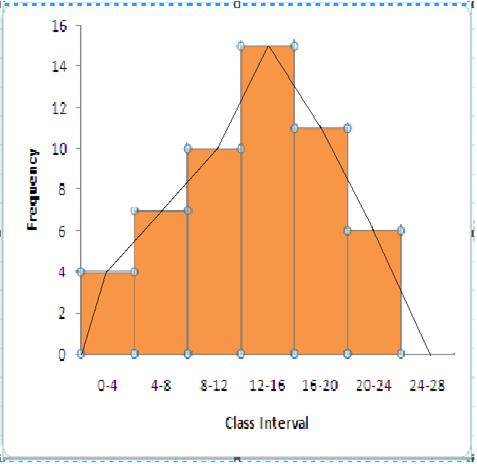
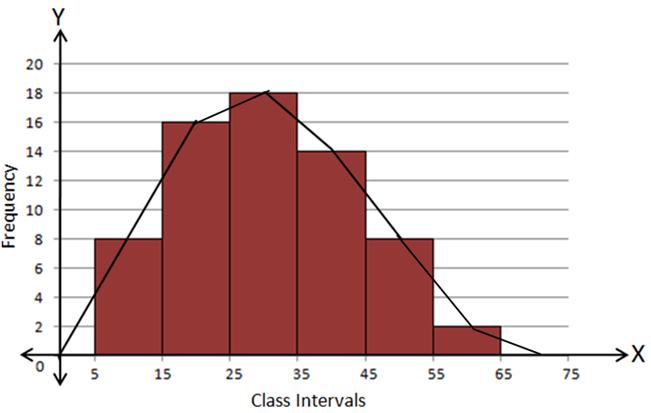
Solution 5(ii)
Using Histogram:
|
C.I. |
f |
|
5 - 15 |
8 |
|
15 - 25 |
16 |
|
25 - 35 |
18 |
|
35 - 45 |
14 |
|
45 - 55 |
8 |
|
55 - 65 |
2 |
Steps:
- Draw a histogram for the given data.
- Mark the mid-point at the top of each rectangle of the histogram drawn.
- Also, mark the mid-point of the immediately lower class-interval and mid-point of the immediately higher class-interval.
- Join the consecutive mid-points marked by straight lines to obtain the required frequency polygon.
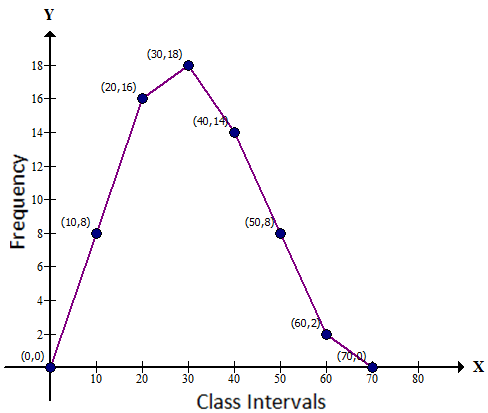
Without using Histogram:
Steps:
-
Find the class-mark (mid-value) of each given class-interval.
- On a graph paper, mark class-marks along X-axis and frequencies along Y-axis.
- On this graph paper, mark points taking values of class-marks along X-axis and the values of their corresponding frequencies along Y-axis.
- Draw line segments joining the consecutive points marked in step (3) above.
|
C.I. |
Class-mark |
f |
|
-5 - 5 |
0 |
0 |
|
5 - 15 |
10 |
8 |
|
15 - 25 |
20 |
16 |
|
25 - 35 |
30 |
18 |
|
35 - 45 |
40 |
14 |
|
45 - 55 |
50 |
8 |
|
55 - 65 |
60 |
2 |
|
65 - 75 |
70 |
0 |
Solution 6
The frequency distribution table is as follows:
Solution 7
The cumulative frequency distribution table is as follows:
|
Class Interval |
Frequency |
Cumulative Frequency |
|
20-29 |
18 |
18 |
|
30-39 |
23 |
18 + 23 = 41 |
|
40-49 |
36 |
41 + 36 = 77 |
|
50-59 |
42 |
77 + 42 = 119 |
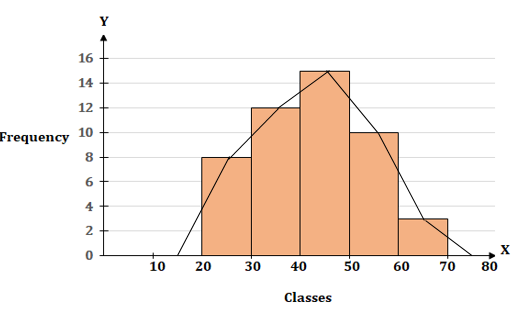
Solution 8
Steps:
1. Draw a histogram for the given data
2. Mark the mid-point at the top of each rectangle of the histogram drawn.
3. Also, mark the mid-point of the immediately lower class-interval (10-20) and mid-point of the immediately higher class-interval (70-80).
4. Join the consecutive mid-points marked by straight lines to obtain the required frequency polygon.