
Class 9 SELINA Solutions Maths Chapter 26 - Coordinate Geometry
Coordinate Geometry Exercise Ex. 26(A)
Solution 1(a)
Correct option: (i) 0
2x - 5 = 0
∴x = 5/2
Now, this line is parallel to y axis, hence y co-ordinate or ordinate is 0
Solution 1(b)
Correct option: (ii) x
x is the independent variable
y is the dependent variable
Solution 1(c)
Correct option: (iii) x = 2, y = 5
2x - 1 = 3
∴ x = 2
y + 5 = 10
∴ y = 5
Solution 1(d)
Correct option: (iv) 4th quadrant
In 4th quadrant x co-ordinate is positive and y co-ordinate is negative.
Solution 1(e)
Correct option: (i) (3, 2)
3x - 2 = 7
∴ x = 3
8 - 3y = 2
∴ y = 2
∴(3, 2)
Solution 2
(i)![]()
Dependent variable is ![]()
Independent variable is ![]()
(ii)![]()
Dependent variable is ![]()
Independent variable is ![]()
(iii)![]()
Dependent variable is ![]()
Independent variable is ![]()
(iv)![]()
Dependent variable is ![]()
Independent variable is ![]()
Solution 3
Let us take the point as
![]() ,
,![]() ,
, ![]() ,
,![]() ,
,![]() ,
,![]() ,
,![]() ,
,![]() ,
,![]()
On the graph paper, let us draw the co-ordinate axes XOX' and YOY' intersecting at the origin O. With proper scale, mark the numbers on the two co-ordinate axes.
Now for the point A(8,7)
Step I
Starting from origin O, move 8 units along the positive direction of X axis, to the right of the origin O
Step II
Now from there, move 7 units up and place a dot at the point reached. Label this point as A(8,7)
Similarly plotting the other points
![]() ,
, ![]() ,
,![]() ,
,![]() ,
,![]() ,
,![]() ,
,![]() ,
,![]()
Solution 4
Two ordered pairs are equal.
![]() Therefore their first components are equal and their second components too are separately equal.
Therefore their first components are equal and their second components too are separately equal.
(i)![]()

(ii)![]()

(iii)![]()
![]()
Now multiplying the equation (B) by 3, we get
![]()
Now adding both the equations (A) and (C) , we get

Putting the value of x in the equation (B), we get

Therefore we get,
x = 2, y = 2
Solution 5
(i) The abscissa is 2
Now using the given graph the co-ordinate of the given point A is given by (2,2)
(ii) The ordinate is 0
Now using the given graph the co-ordinate of the given point B is given by (5,0)
(iii) The ordinate is 3
Now using the given graph the co-ordinate of the given point C and E is given by (-4,3)& (6,3)
(iv) The ordinate is -4
Now using the given graph the co-ordinate of the given point D is given by (2,-4)
(v) The abscissa is 5
Now using the given graph the co-ordinate of the given point H, B and G is given by (5,5) ,(5,0) & (5,-3)
(vi)The abscissa is equal to the ordinate.
Now using the given graph the co-ordinate of the given point I,A & H is given by (4,4),(2,2) & (5,5)
(vii)The ordinate is half of the abscissa
Now using the given graph the co-ordinate of the given point E is given by (6,3)
Solution 6
(i)The ordinate of a point is its x-co-ordinate.
False.
(ii)The origin is in the first quadrant.
False.
(iii)The y-axis is the vertical number line.
True.
(iv)Every point is located in one of the four quadrants.
True.
(v)If the ordinate of a point is equal to its abscissa; the point lies either in the first quadrant or in the second quadrant.
False.
(vi)The origin (0,0) lies on the x-axis.
True.
(vii)The point (a,b) lies on the y-axis if b=0.
False
Solution 7
(i)![]()
Now

Again

![]()
![]() The co-ordinates of the point
The co-ordinates of the point ![]()
(ii)![]()
Now

Again

![]()
![]() The co-ordinates of the point
The co-ordinates of the point ![]()
(iii)![]()
Now

![]()
Again

![]()
![]() The co-ordinates of the point
The co-ordinates of the point ![]()
Solution 8
(i)![]() ,
,![]() and
and ![]()
After plotting the given points A(2,0), B(8,0) and C(8,4) on a graph paper; joining A with B and B with C. From the graph it is clear that the vertical distance between the points B(8,0) and C(8,4) is 4 units, therefore the vertical distance between the points A(2,0) and D must be 4 units. Now complete the rectangle ABCD
As is clear from the graph D(2,4)
(ii)A(4,2), B(-2,2) and D(4,-2)
After plotting the given points A(4,2), B(-2,2) and D(4,-2) on a graph paper; joining A with B and A with D. From the graph it is clear that the vertical distance between the points A(4,2) and D(4,-2) is 4 units and the horizontal distance between the points A(4,2) and B(-2,2) is 6 units , therefore the vertical distance between the points B(-2,2)and C must be 4 units and the horizontal distance between the points B(-2,2) and C must be 6 units. Now complete the rectangle ABCD
As is clear from the graph C(-2,2)
(iii)![]() ,
, ![]() and
and ![]()
After plotting the given points![]() ,
,![]() and
and ![]() on a graph paper; joining
on a graph paper; joining ![]() with
with ![]() and
and ![]() with
with![]() . From the graph it is clear that the vertical distance between the points
. From the graph it is clear that the vertical distance between the points ![]() and
and ![]() is
is ![]() units and the horizontal distance between the points
units and the horizontal distance between the points ![]() and
and ![]() is
is ![]() units , therefore the vertical distance between the points
units , therefore the vertical distance between the points ![]() and
and ![]() must be
must be ![]() units and the horizontal distance between the points
units and the horizontal distance between the points ![]() and
and ![]() must be
must be ![]() units . Now complete the rectangle
units . Now complete the rectangle ![]()
As is clear from the graph ![]()
(iv)![]() ,
, ![]() and
and ![]()
After plotting the given points![]() ,
,![]() and
and ![]() on a graph paper; joining
on a graph paper; joining ![]() with
with ![]() and
and ![]() with
with![]() . From the graph it is clear that the vertical distance between the points
. From the graph it is clear that the vertical distance between the points ![]() and
and ![]() is
is ![]() units and the horizontal distance between the points
units and the horizontal distance between the points ![]() and
and ![]() is
is ![]() units , therefore the vertical distance between the points
units , therefore the vertical distance between the points ![]() and
and ![]() must be
must be ![]() units and the horizontal distance between the points
units and the horizontal distance between the points ![]() and
and ![]() must be
must be ![]() units. Now complete the rectangle
units. Now complete the rectangle ![]()
As is clear from the graph ![]()
Solution 9
Given A(-2,2), B(8,2) and C(4,-4) are the vertices of the parallelogram ABCD
After plotting the given points A(2,-2), B(8,2) and C(4,-4) on a graph paper; joining B with C and B with A . Now complete the parallelogram ABCD.
As is clear from the graph D(-6,4)
Now from the graph we can find the mid points of the sides AB and CD.
Therefore the co-ordinates of the mid-point of AB is E(3,2) and the co-ordinates of the mid-point of CD is F(-1,-4)
Solution 10
Given ![]() ,
, ![]() and
and ![]() are the vertices of a square
are the vertices of a square ![]()
After plotting the given points![]() ,
,![]() and
and ![]() on a graph paper; joining
on a graph paper; joining ![]() with
with ![]() and
and ![]() with
with![]() . Now complete the square
. Now complete the square ![]()
As is clear from the graph ![]()
Now from the graph we can find the mid points of the sides ![]() and
and ![]() and the co-ordinates of the diagonals of the square.
and the co-ordinates of the diagonals of the square.
Therefore the co-ordinates of the mid-point of ![]() is
is ![]() and the co-ordinates of the mid-point of
and the co-ordinates of the mid-point of ![]() is
is ![]() and the co-ordinates of the diagonals of the square is
and the co-ordinates of the diagonals of the square is ![]()
Coordinate Geometry Exercise Ex. 26(B)
Solution 1(a)
Correct option: (i) parallel to x-axis
y + 7 = 0
∴ y = -7
∴ This is parallel to x-axis
Solution 1(b)
Correct option: (iii) x = 5
5 units on positive side of x-axis means, the line will be x = 5.
Solution 1(c)
Correct option: (i) 1
6x - 5y = 7
Substituting x = 2, we get,
∴ 6(2) - 5y = 7
∴ 12 - 7 = 5y
∴ y = 1
Solution 1(d)
Correct option: (iii) 4
Solution 1(e)
Correct option:
(ii) ![]()
Solution 2
(i) Since x = 3, therefore the value of y can be taken as any real no.
First prepare a table as follows:
|
x |
3 |
3 |
3 |
|
y |
-1 |
0 |
1 |
Thus the graph can be drawn as follows:
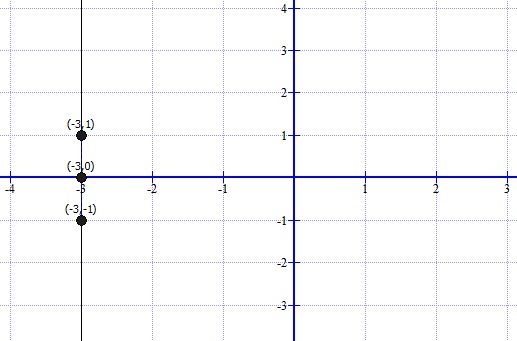
(ii)
First prepare a table as follows:
|
x |
-3 |
-3 |
-3 |
|
y |
-1 |
0 |
1 |
Thus the graph can be drawn as follows:
(iii)
First prepare a table as follows:
|
x |
5 |
5 |
5 |
|
y |
-1 |
0 |
1 |
Thus the graph can be drawn as follows:
(iv)
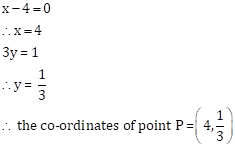
The equation can be written as:
![]()
First prepare a table as follows:
|
x |
|
|
|
|
y |
-1 |
0 |
1 |
Thus the graph can be drawn as follows:
(v)
First prepare a table as follows:
|
x |
-1 |
0 |
1 |
|
y |
4 |
4 |
4 |
Thus the graph can be drawn as follows:
(vi)
First prepare a table as follows:
|
x |
-1 |
0 |
1 |
|
y |
-6 |
-6 |
-6 |
Thus the graph can be drawn as follows:
(vii)
First prepare a table as follows:
|
x |
-1 |
0 |
1 |
|
y |
2 |
2 |
2 |
Thus the graph can be drawn as follows:
(viii)
First prepare a table as follows:
|
x |
-1 |
0 |
1 |
|
y |
y = -5/3 |
-6 |
3y + 5 = 0 |
Thus the graph can be drawn as follows:

(ix)
First prepare a table as follows:
|
x |
-1 |
0 |
1 |
|
y |
|
|
|
Thus the graph can be drawn as follows:
(x)
First prepare a table as follows:
|
x |
-1 |
0 |
1 |
|
y |
0 |
0 |
0 |
Thus the graph can be drawn as follows:
(xi)
First prepare a table as follows:
|
x |
0 |
0 |
0 |
|
y |
-1 |
0 |
1 |
Thus the graph can be drawn as follows:
Solution 3
(i)
First prepare a table as follows:
|
x |
-1 |
0 |
1 |
|
y |
-3 |
0 |
3 |
Thus the graph can be drawn as follows:
(ii)
First prepare a table as follows:
|
x |
-1 |
0 |
1 |
|
y |
1 |
0 |
-1 |
Thus the graph can be drawn as follows:
(iii)
First prepare a table as follows:
|
x |
-1 |
0 |
1 |
|
y |
2 |
0 |
-2 |
Thus the graph can be drawn as follows:
(iv)
First prepare a table as follows:
|
x |
-1 |
0 |
1 |
|
y |
-1 |
0 |
1 |
Thus the graph can be drawn as follows:
(v)
First prepare a table as follows:
|
x |
-1 |
0 |
1 |
|
y |
5 |
0 |
-5 |
Thus the graph can be drawn as follows:
(vi)
First prepare a table as follows:
|
x |
-1 |
0 |
1 |
|
y |
|
0 |
|
Thus the graph can be drawn as follows:
(vii)
First prepare a table as follows:
|
x |
-1 |
0 |
1 |
|
y |
-4 |
0 |
4 |
Thus the graph can be drawn as follows:
(viii)
First prepare a table as follows:
|
x |
-1 |
0 |
1 |
|
y |
|
0 |
|
Thus the graph can be drawn as follows:
(ix)
First prepare a table as follows:
|
x |
-1 |
0 |
1 |
|
y |
|
0 |
|
Thus the graph can be drawn as follows:
Solution 4
(i)
First prepare a table as follows:
|
x |
-1 |
0 |
1 |
|
y |
1 |
3 |
5 |
Thus the graph can be drawn as follows:
(ii)
First prepare a table as follows:
|
x |
-1 |
0 |
1 |
|
y |
|
-1 |
|
Thus the graph can be drawn as follows:
(iii)
First prepare a table as follows:
|
x |
-1 |
0 |
1 |
|
y |
5 |
4 |
3 |
Thus the graph can be drawn as follows:
(iv)
First prepare a table as follows:
|
x |
-1 |
0 |
1 |
|
y |
|
|
|
Thus the graph can be drawn as follows:
(v)
First prepare a table as follows:
|
x |
-1 |
0 |
1 |
|
y |
|
|
|
Thus the graph can be drawn as follows:
(vi)
First prepare a table as follows:
|
x |
-1 |
0 |
1 |
|
y |
-2 |
|
|


Thus the graph can be drawn as follows:
(vii)
The equation will become:
![]()
First prepare a table as follows:
|
x |
-1 |
0 |
1 |
|
y |
|
|
|
Thus the graph can be drawn as follows:
(viii)
The equation will become:
![]()
First prepare a table as follows:
|
x |
-1 |
0 |
1 |
|
y |
|
|
|
Thus the graph can be drawn as follows:
(ix)
First prepare a table as follows:
|
x |
-1 |
0 |
1 |
|
y |
|
|
|
Thus the graph can be drawn as follows:
Solution 5
(i)
To draw the graph of 3x + 2y = 6 follows the steps:
First prepare a table as below:
|
X |
-2 |
0 |
2 |
|
Y |
6 |
3 |
0 |
Now sketch the graph as shown:
From the graph it can verify that the line intersect x axis at (2,0) and y at (0,3).
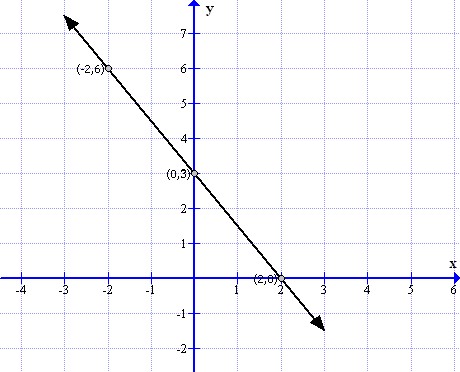
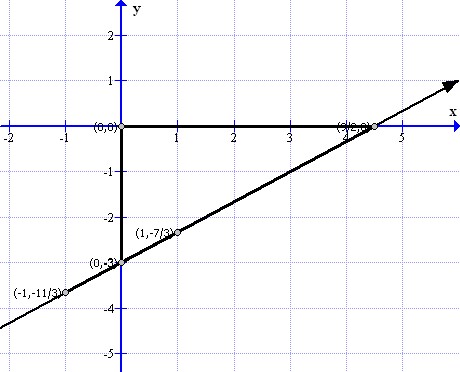
(ii)
To draw the graph of 2x - 5y = 10 follows the steps:
First prepare a table as below:
|
X |
-1 |
0 |
1 |
|
Y |
|
-2 |
|
Now sketch the graph as shown:
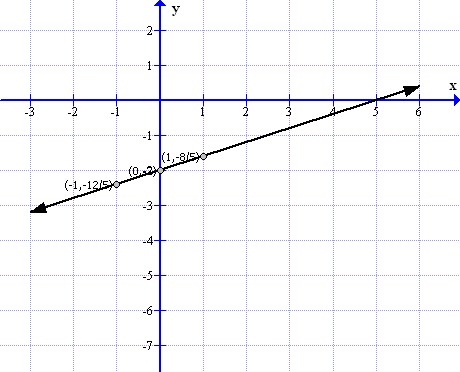
From the graph it can verify that the line intersect x axis at (5,0) and y at (0,-2).
(iii)
To draw the graph of  follows the steps:
First prepare a table as below:
|
X |
-1 |
0 |
1 |
|
Y |
5.25 |
4.5 |
3.75 |
Now sketch the graph as shown:
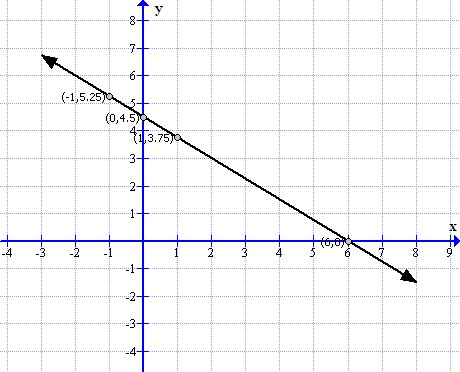
From the graph it can verify that the line intersect x axis at (10,0) and y at (0,7.5).
(iv)
To draw the graph of  follows the steps:
First prepare a table as below:
|
X |
-1 |
0 |
1 |
|
Y |
-3 |
|
|


Now sketch the graph as shown:
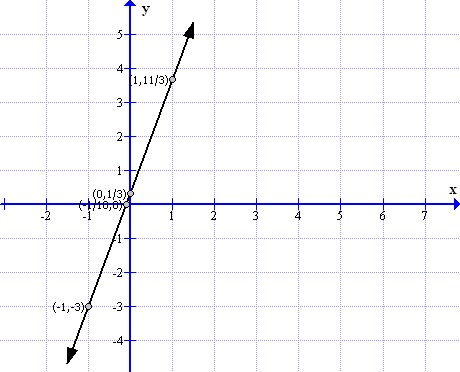
From the graph it can verify that the line intersect x axis at  and y at (0,4.5).
Solution 6
(i)
First draw the graph as follows:
This is an right trinangle.
Thus the area of the triangle will be:

(ii)
First draw the graph as follows:
This is a right triangle.
Thus the area of the triangle will be:

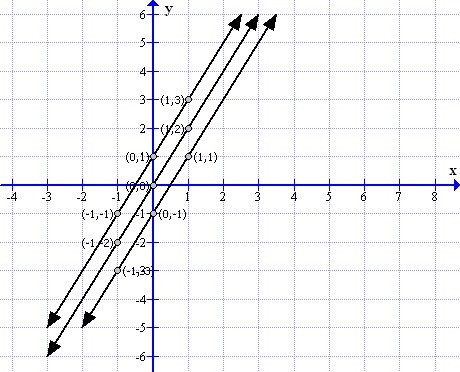
Solution 7
(i)
To draw the graph of y = 3x - 1 and y = 3x + 2 follows the steps:
First prepare a table as below:
|
X |
-1 |
0 |
1 |
|
Y=3x-1 |
-4 |
-1 |
2 |
|
Y=3x+2 |
-1 |
2 |
5 |
Now sketch the graph as shown:
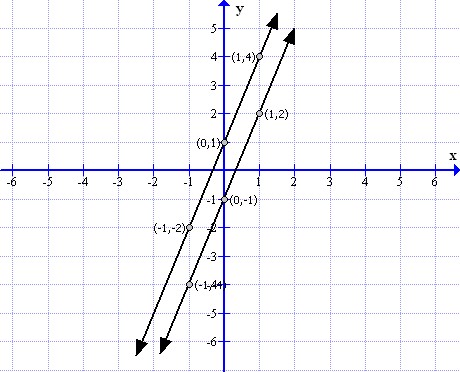
From the graph it can verify that the lines are parallel.
(ii)
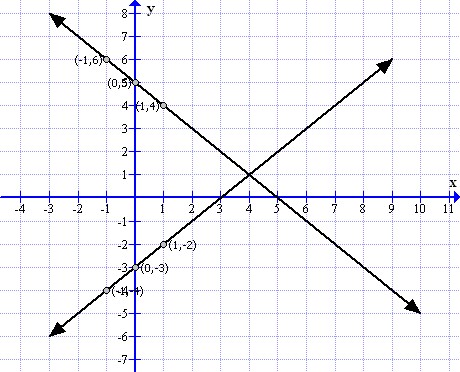
To draw the graph of y = x - 3 and y = -x + 5 follows the steps:
First prepare a table as below:
|
X |
-1 |
0 |
1 |
|
Y=x-3 |
-4 |
-3 |
-2 |
|
Y=-x+5 |
6 |
5 |
4 |
Now sketch the graph as shown:
From the graph it can verify that the lines are perpendicular.
(iii)
To draw the graph of 2x - 3y = 6 and  follows the steps:
First prepare a table as below:
|
X |
-1 |
0 |
1 |
|
|
|
-2 |
|
|
|
|
3 |
|


Now sketch the graph as shown:
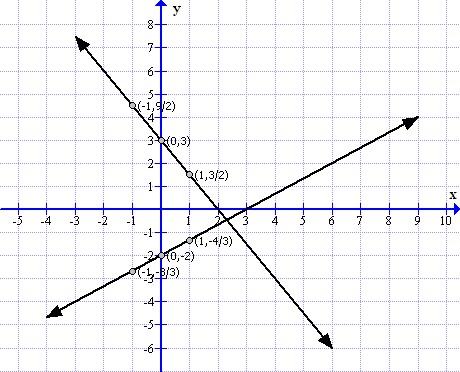
From the graph it can verify that the lines are perpendicular.
(iv)
To draw the graph of 3x + 4y = 24 and  follows the steps:
First prepare a table as below:
|
X |
-1 |
0 |
1 |
|
|
|
6 |
|
|
|
|
3 |
|


Now sketch the graph as shown:
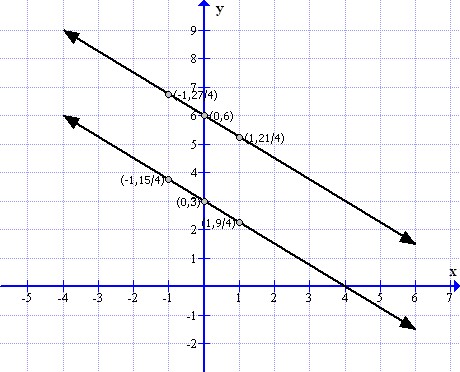
From the graph it can verify that the lines are parallel.
Solution 8
First prepare a table as follows:
|
X |
-1 |
0 |
1 |
|
Y=x-2 |
-3 |
-2 |
-1 |
|
Y=2x+1 |
-1 |
1 |
3 |
|
Y=4 |
4 |
4 |
4 |
Now the graph can be drawn as follows:
Solution 9
First prepare a table as follows:
|
X |
-1 |
0 |
1 |
|
Y=2x-1 |
-3 |
-1 |
1 |
|
Y = 2x |
-2 |
0 |
2 |
|
Y=2x+1 |
-1 |
1 |
3 |
Now the graph can be drawn as follows:
The lines are parallel to each other.
Solution 10
To draw the graph of 3x + 2y = 6 follows the steps:
First prepare a table as below:
|
X |
-2 |
0 |
2 |
|
Y |
6 |
3 |
0 |
Now sketch the graph as shown:
From the graph it can verify that the line intersect x axis at (2,0) and y at (0,3), therefore the co ordinates of P(x-axis) and Q(y-axis) are (2,0) and (0,3) respectively.
Coordinate Geometry Exercise Ex. 26(C)
Solution 1(a)
Correct option:
(iii)![]()
![]()
Solution 1(b)
Correct option:
(iv)![]()
2x - 5y = 8
5y = 2x - 8
![]()
Comparing with y = mx + c, we get
Slope = ![]()
Solution 1(c)
Correct option:
(iv) ![]()
5x - 6y = 9
6y = 5x - 9

Comparing with y = mx + c, we get
y-intercept as ![]()
Solution 1(d)
Correct option: (i) 2x + y + 7 = 0
Equation of line is given by
∴ y = mx + c
∴ y = -2x - 7
∴ 2x + y + 7 = 0
Solution 1(e)
Correct option: (i) m = 1, c = 1
x - y + 1 = 0
∴ y = x + 1
Comparing with y = mx + c, we get
m = 1 and c = 1
Solution 2
The angle which a straight line makes with the positive direction of x-axis (measured in anticlockwise direction) is called inclination o the line.
The inclination of a line is usually denoted by θ
(i)The inclination is θ = 45°
(ii) The inclination is θ = 135°
(iii) The inclination is θ = 30°
Solution 3
(i)The inclination of a line parallel to x-axis is θ = 0°
(ii)The inclination of a line perpendicular to x-axis is θ = 90°
(iii) The inclination of a line parallel to y-axis is θ = 90°
(iv) The inclination of a line perpendicular to y-axis is θ = 0°
Solution 4
If θ is the inclination of a line; the slope of the line is tan θ and is usually denoted by letter m.
(i)Here the inclination of a line is 0°, then θ = 0°
Therefore the slope of the line is m = tan 0° = 0
(ii)Here the inclination of a line is 30°, then θ = 30°
Therefore the slope of the line is m = tan θ = 30° = 
(iii)Here the inclination of a line is 45° , then θ = 45°
Therefore the slope of the line is m = tan 45° = 1
(iv)Here the inclination of a line is 60°, then θ = 60°
Therefore the slope of the line is m = tan 60° = √3
Solution 5
If tan θ is the slope of a line; then inclination of the line is θ
(i)Here the slope of line is 0; then tan θ = 0
Now

Therefore the inclination of the given line is θ = 0°
(ii)Here the slope of line is 1; then tan θ = 1
Now

Therefore the inclination of the given line is θ = 45°
(iii)Here the slope of line is  ; then tan θ = √3
Now

Therefore the inclination of the given line is θ = 60°
(iv)Here the slope of line is ; then 
Now

Therefore the inclination of the given line is θ = 30°
Solution 6
(i)For any line which is parallel to x-axis, the inclination is θ = 0°
Therefore, Slope(m) = tan θ = tan 0° = 0
(ii) For any line which is perpendicular to x-axis, the inclination is θ = 90°
Therefore, Slope(m) = tan θ = tan 90° = ∞(not defined)
(iii) For any line which is parallel to y-axis, the inclination is θ = 90°
Therefore, Slope(m) = tan θ = tan 90° = ∞(not defined)
(iv) For any line which is perpendicular to y-axis, the inclination is θ = 0°
Therefore, Slope(m) = tan θ = tan 0° = 0
Solution 7
Equation of any straight line in the form y = mx + c, where slope = m(co-efficient of x) and
y-intercept = c(constant term)
(i)![]()

Therefore,
![]()
![]()
(ii)![]()

Therefore,
![]()
![]()
(iii) ![]()

Therefore,
![]()
![]()
(iv) ![]()

Therefore,
![]()
![]()
(v) ![]()
![]()
Therefore,
![]()
![]()
(vi) ![]()

Therefore,
![]()
![]()
(vii) ![]()

Therefore,
![]()
![]()
Solution 8
(i)Given
Slope is 2, therefore m = 2
Y-intercept is 3, therefore c = 3
Therefore,
![]()
Therefore the equation of the required line is y = 2x + 3
(ii)Given
Slope is 5, therefore m = 5
Y-intercept is -8, therefore c = -8
Therefore,
![]()
Therefore the equation of the required line is y = 5x + (-8)
(iii)Given
Slope is -4, therefore m = -4
Y-intercept is 2, therefore c = 2
Therefore,
![]()
Therefore the equation of the required line is y = -4x + 2
(iv)Given
Slope is -3, therefore m = -3
Y-intercept is -1, therefore c = -1
Therefore,
![]()
Therefore the equation of the required line is y = -3x - 1
(v)Given
Slope is 0, therefore m = 0
Y-intercept is -5, therefore c = -5
Therefore,

Therefore the equation of the required line is y = -5
(vi)Given
Slope is 0, therefore m = 0
Y-intercept is 0, therefore c = 0
Therefore,

Therefore the equation of the required line is y = 0
Solution 9
Given line is 3x + 4y = 12
The graph of the given line is shown below.
Clearly from the graph we can find the y-intercept.
The required y-intercept is 3
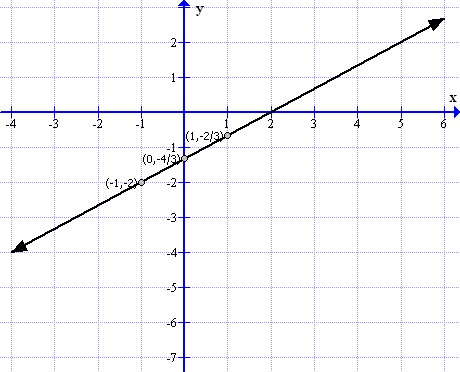
Solution 10
Given line is
2x - 3y - 18 = 0
The graph of the given line is shown below.
Clearly from the graph we can find the y-intercept.
The required y-intercept is -6
Coordinate Geometry Exercise Test Yourself
Solution 1
After plotting the given points, we have clearly seen from the graph that
(i) ![]() ,
, ![]() and
and ![]() are collinear.
are collinear.
(ii)![]() ,
, ![]() and
and ![]() are non-collinear.
are non-collinear.
Solution 2
Given ![]()
After plotting the given point ![]() on a graph paper. Now let us draw a perpendicular
on a graph paper. Now let us draw a perpendicular ![]() from the point
from the point ![]() on the x-axis and a perpendicular
on the x-axis and a perpendicular ![]() from the point
from the point ![]() on the y-axis.
on the y-axis.
As from the graph clearly we get the co-ordinates of the points ![]() and
and ![]()
Co-ordinate of the point ![]() is
is ![]()
Co-ordinate of the point ![]() is
is ![]()
Solution 3
Given that in square ![]() ;
; ![]() ,
, ![]() and
and ![]()
After plotting the given points![]() ,
,![]() and
and ![]() on a graph paper; joining
on a graph paper; joining ![]() with
with ![]() and
and ![]() with
with![]() . From the graph it is clear that the vertical distance between the points
. From the graph it is clear that the vertical distance between the points ![]() and
and ![]() is
is ![]() units and the horizontal distance between the points
units and the horizontal distance between the points ![]() and
and ![]() is
is ![]() units , therefore the vertical distance between the points
units , therefore the vertical distance between the points ![]() and
and ![]() must be
must be ![]() units and the horizontal distance between the points
units and the horizontal distance between the points ![]() and
and ![]() must be
must be ![]() units. Now complete the square
units. Now complete the square ![]()
As is clear from the graph ![]()
Now the area of the square ![]() is given by
is given by
![]()
Solution 4
Given that in rectangle ![]() ; point
; point ![]() is origin and
is origin and ![]() units along x-axis therefore we get
units along x-axis therefore we get ![]() and
and![]() . Also it is given that
. Also it is given that ![]() units. Thereforewe get
units. Thereforewe get ![]() and
and ![]()
After plotting the points ![]() ,
, ![]() ,
, ![]() and
and ![]() on a graph paper; we get the above rectangle
on a graph paper; we get the above rectangle ![]() and the requiredco-ordinates of the vertices are
and the requiredco-ordinates of the vertices are ![]() ,
,![]() and
and ![]()
Solution 5
First prepare a table as follows:
|
X |
-1 |
0 |
1 |
|
Y |
2 |
|
1 |

Thus the graph can be drawn as shown:
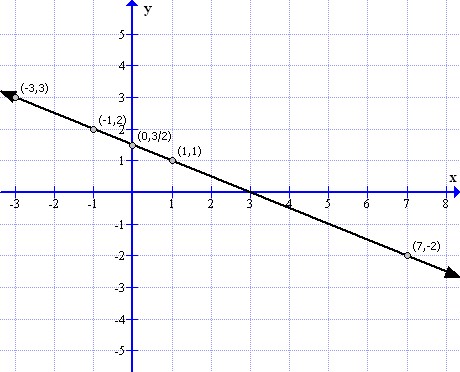
(i)
For y = 3 we have x = -3
(ii)
For y = -2 we have x = 7
Solution 6
First prepare a table as follows:
|
x |
-1 |
0 |
1 |
|
y |
|
-3 |
|
The graph of the equation can be drawn as follows:
From the graph it can be verify that
If x = 4 the value of y = 0
If x = 0 the value of y = -3.
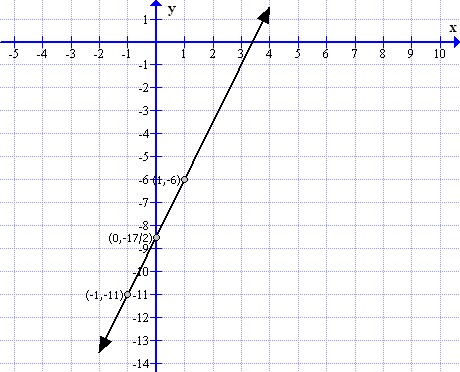
Solution 7
First prepare a table as follows:
|
x |
-1 |
0 |
1 |
|
y |
|
5 |
|
The graph of the equation can be drawn as follows:
From the graph it can be verified that:
for y = 10, the value of x = -4.
for x = 8 the value of y = -5.
Solution 8
The equations can be written as follows:
y = 2 - x


First prepare a table as follows:
|
x |
y = 2 - x |
|
|
|
-1 |
3 |
|
|
|
0 |
2 |
|
0 |
|
1 |
1 |
-2 |
|
Thus the graph can be drawn as follows:
From the graph it is clear that the equation of lines are passes through the same point.
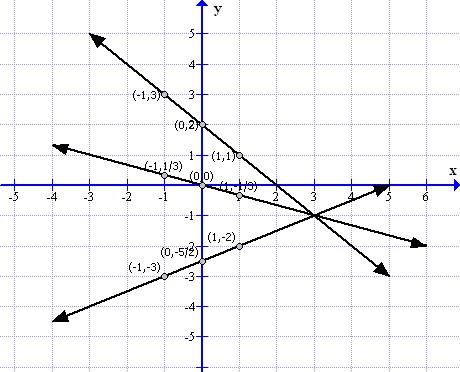
Solution 9
Given line is
x + y = 5
The graph of the given line is shown below.
From the given line x + y = 5, we get

Again we know that equation of any straight line in the form y = mx + c, where m is the gradient and c is the intercept. Again we have if slope of a line is tan θ then inclination of the line is θ
Now from the equation (A) , we have

And c = 5
Therefore the required inclination is θ = 135° and y-intercept is c = 5
Solution 10
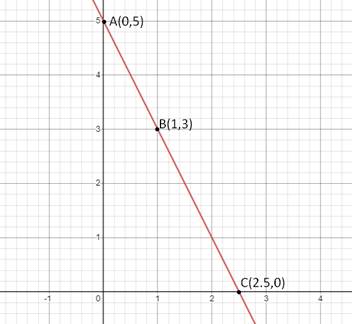
2x + y = 5
|
x |
0 |
2.5 |
1 |
|
y |
5 |
0 |
3 |
|
(x,y) |
(0,5) |
(2.5,0) |
(1,3) |
Scale: 1cm = 1 unit on both axes
Solution 11
4x - y = 5
|
x |
0 |
1 |
|
y |
-5 |
-1 |
|
(x,y) |
(0,-5) |
(1,-1) |
Scale: 1cm = 2 units on both axes
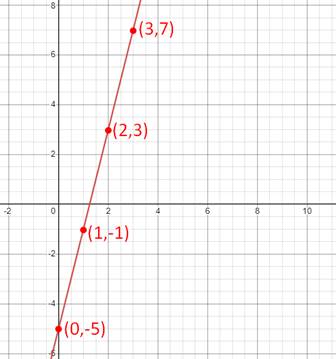
From graph,
y = 3 then x = 2
x = 3 then y = 7
