
Class 10 SELINA Solutions Maths Chapter 24 - Measures of Central Tendency (Mean, Median, Quartiles and Mode)
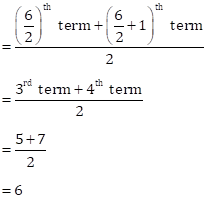
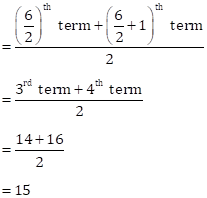
Measures of Central Tendency (Mean, Median, Quartiles and Mode) Exercise TEST YOURSELF
Solution 1(e)
Correct option: (iii) 44
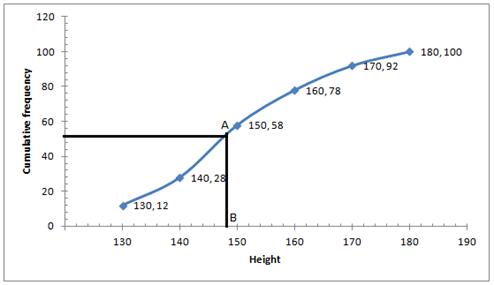
n = 80 (even)
From an ogive,
![]()
![]()
Inter-quartile range = Q3 – Q1 = 54 – 10 = 44
Solution 1(d)
Correct option: (iii) 6
First six prime numbers are as follows:
2, 3, 5, 7, 11, 13
Number of observations, n = 6 (even)
Median = 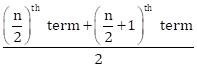
Solution 1(c)
Correct option: (iv) 21
Data arranged in ascending order,
10, 12, 14, 16, 17, x
Number of observations, n = 6 (even)
Median = 
![]()
Now, Mean = Median
Solution 1(b)
Correct option: (i) 12
Data arranged in ascending order,
8, 8, 9, 10, 12, 12, 12, 13, 15
Number of observations, n = 9 (odd)
Then, median = ![]()
Solution 1(a)
Correct option: (i)![]()
Given A.P. is 2, 4, 6, 8, ….., 40
Here, first term, a = 2 and common difference, d = 2
Last term, 40 = 2 + (n – 1)(2)
38 = (n – 1)(2)
n = 20
Solution 2
Mean of 1, 7, 5, 3, 4 and 4 = ![]()
 m=4
m=4
Now, mean of 3, 2, 4, 2, 3, 3 and p = m-1 = 4-1 = 3
Therefore, 17+p = 3 x n …. Where n = 7
17+p = 21
p = 4
Arranging in ascending order:
2, 2, 3, 3, 3, 3, 4, 4
Mean = 4th term = 3
Therefore, q = 3
Solution 3
|
Date |
Number |
C.f. |
|
1 |
5 |
5 |
|
2 |
12 |
17 |
|
3 |
20 |
37 |
|
4 |
27 |
64 |
|
5 |
46 |
110 |
|
6 |
30 |
140 |
|
7 |
31 |
171 |
|
8 |
18 |
189 |
|
9 |
11 |
200 |
|
10 |
5 |
205 |
|
11 |
0 |
205 |
|
12 |
1 |
206 |
(i) Mode = 5th July as it has maximum frequencies.
(ii) Total number of terms = 206
Upper quartile = 
Lower quartile = ![]()
Solution 4
|
Marks |
No. of students |
c.f. |
|
0-10 |
5 |
5 |
|
10-20 |
9 |
14 |
|
20-30 |
16 |
30 |
|
30-40 |
22 |
52 |
|
40-50 |
26 |
78 |
|
50-60 |
18 |
96 |
|
60-70 |
11 |
107 |
|
70-80 |
6 |
113 |
|
80-90 |
4 |
117 |
|
90-100 |
3 |
120 |
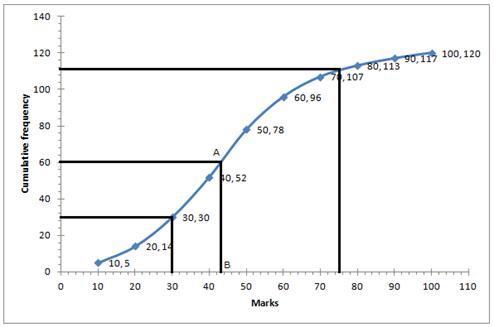
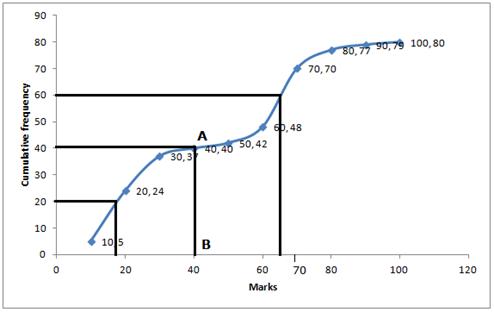
(i) ![]()
Through mark 60.5, draw a parallel line to x-axis which meets the curve at A, From A draw a perpendicular to x-axis meeting it at B.
The value of point B is the median = 43
(ii) Number of students who obtained up to 75% marks in the test = 110
Number of students who obtained more than 75% marks in the test = 120 - 110 = 10
(iii) Number of students who obtained less than 40% marks in the test = 52 (from the graph; x=40, y=52)
(iv) Lower quartile = Q1 = ![]()
Solution 5
|
Weight |
Frequency |
C. f. |
|
40-45 |
5 |
5 |
|
45-50 |
17 |
22 |
|
50-55 |
22 |
44 |
|
55-60 |
45 |
89 |
|
60-65 |
51 |
140 |
|
65-70 |
31 |
171 |
|
70-75 |
20 |
191 |
|
75-80 |
9 |
200 |
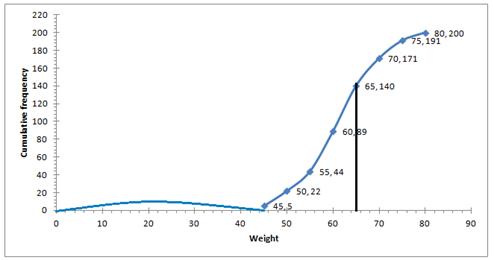
(i) Number of students weighing more than 55 kg = 200-44 = 156
Therefore, percentage of students weighing 55 kg or more
![]()
(ii) 30% of students = ![]()
Heaviest 60students in weight = 9 + 21 + 30 = 60
weight = 65 kg ( from table)
(iii) (a) underweight students when 55.70 kg is standard = 46 (approx) from graph
(b) overweight students when 55.70 kg is standard = 200- 55.70 = 154 (approx) from graph
Solution 6
|
Marks obtained(x) |
No. of students (f) |
c.f. |
fx |
|
5 |
3 |
3 |
15 |
|
6 |
9 |
12 |
54 |
|
7 |
6 |
18 |
42 |
|
8 |
4 |
22 |
32 |
|
9 |
2 |
24 |
18 |
|
10 |
1 |
25 |
10 |
|
Total |
25 |
171 |
Number of terms = 25
(i) Mean = 
(ii) ![]()
(iii) Mode = 6 as it has maximum frequencies i.e. 6
Solution 7
|
Monthly Income (thousands) |
No. of employees (f) |
Cumulative frequency |
|
6-7 |
20 |
20 |
|
7-8 |
45 |
65 |
|
8-9 |
65 |
130 |
|
9-10 |
95 |
225 |
|
10-11 |
60 |
285 |
|
11-12 |
30 |
315 |
|
12-13 |
5 |
320 |
|
Total |
320 |
Number of employees = 320
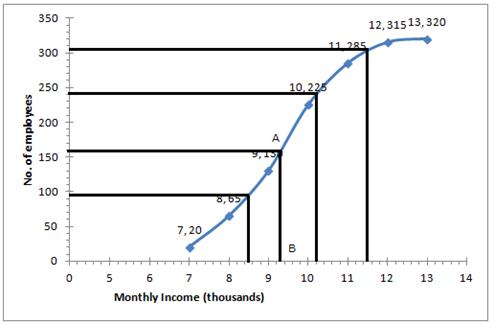
(i) ![]()
Through mark 160, draw a parallel line to x-axis which meets the curve at A, From A draw a perpendicular to x-axis meeting it at B.
The value of point B is the median = Rs 9.3 thousands
(ii) The number of employees with income below Rs 8500 = 95 (approx from the graph)
(iii) Number of employees with income below Rs 11500 = 305 (approx from the graph)
Therefore number of employees (senior employees) = 320-305 =15
(iv) Upper quartile = ![]()
Solution 8

Solution 9

Solution 10
![]()

Solution 11
Here the number of observations i. e is 10, which is even.'
So, the given data is 13, 35, 43, 46, 46, 50, 55, 61, 71, 80.
In the given data, 46 occurs most frequently.
∴ Mode = 46
Solution 12
i. The frequency distribution table is as follows:
|
Class interval |
Frequency |
|
0-10 |
2 |
|
10- 20 |
5 |
|
20-30 |
8 |
|
30-40 |
4 |
|
40-50 |
6 |
ii.
|
Class interval |
Frequency (f) |
Mean value (x) |
fx |
|
0-10 |
2 |
5 |
10 |
|
10- 20 |
5 |
15 |
75 |
|
20-30 |
8 |
25 |
200 |
|
30-40 |
4 |
35 |
140 |
|
40-50 |
6 |
45 |
270 |
|
|
Sf = 25 |
|
Sf = 695 |
![]()
iii. Here the maximum frequency is 8 which is corresponding to class 20 - 30.
Hence, the modal class is 20 - 30.
Measures of Central Tendency (Mean, Median, Quartiles and Mode) Exercise Ex. 24(A)
Solution 2
(a) Here n = 9

(b)
If marks of each student be increased by 4 then new arithmetic mean will be = 59 + 4 = 63
Solution 3
(a) The mean of 7, 11, 6, 5 and 6
![]()
(b)
If we subtract 2 from each number, then the mean will be 7-2 = 5
Solution 4
No. of terms = 5
Mean = 8
Sum of numbers = 8 x 5 = 40 .(i)
But, sum of numbers = 6+4+7+a+10 = 27+a ..(ii)
From (i) and (ii)
27+a = 40
a = 13
Solution 5
No. of terms = 5 and mean = 8
Sum of numbers = 5 x 8 = 40 ..(i)
but sum of numbers = 6+y+7+x+14 = 27+y+x .(ii)
from (i) and (ii)
27 + y + x = 40
x + y = 13
y = 13 - x
Solution 6
|
Age in yrs xi |
Frequency (fi) |
fixi |
|
12 |
2 |
24 |
|
13 |
4 |
52 |
|
14 |
6 |
84 |
|
15 |
9 |
135 |
|
16 |
8 |
128 |
|
17 |
7 |
119 |
|
18 |
4 |
72 |
|
Total |
40 |
614 |

Solution 7
No. of terms = 10
Mean = 69.5
Sum of the numbers = 69.5 x 10 = 695 ..........(i)
But sum of numbers = 72+70+x+62+ 50+71+90+64+58+82
= 619 + x ......(ii)
from (i) and (ii)
619 + x = 695
x = 76
Solution 8
|
Height (cm) xi |
No. of Plants fi |
fixi |
|
50 |
2 |
100 |
|
55 |
4 |
220 |
|
58 |
10 |
580 |
|
60 |
f |
60f |
|
65 |
5 |
325 |
|
70 |
4 |
280 |
|
71 |
3 |
213 |
|
Total |
28+f |
1718 + 60f |
Mean = 60.95

Solution 9
|
Wages (Rs/day) (x) |
No. of Workers (f) |
fx |
|
50 |
2 |
100 |
|
60 |
4 |
240 |
|
70 |
8 |
560 |
|
80 |
12 |
960 |
|
90 |
10 |
900 |
|
100 |
6 |
600 |
|
Total |
42 |
3360 |

(i) Mean remains the same if the number of workers in each category is doubled.
Mean = 80
(ii) Mean will be increased by 60% if the wages per day per worker is increased by 60%
New mean = ![]()
(iii) No change in the mean if the number of workers is doubled but if wages per worker is reduced by 40%, then
New mean = ![]()
Solution 10
|
No. of matches (x) |
No. of boxes (f) |
fx |
|
35 |
6 |
210 |
|
36 |
10 |
360 |
|
37 |
18 |
666 |
|
38 |
25 |
950 |
|
39 |
21 |
819 |
|
40 |
12 |
480 |
|
41 |
8 |
328 |
|
Total |
100 |
3813 |
(i) 
(ii) In the second case,
New mean = 39 matches
Total contents = 39 x 100 = 3900
But total number of matches already given = 3813
Number of new matches to be added = 3900 - 3813 = 87
Solution 11

Solution 12

Solution 13

Solution 14

Solution 1(a)
Correct option: (i) 38
Let the fifth variable be x.
Then,
![]()
62 + x = 100
x = 38
Solution 1(b)
Correct option: (ii) 136 cm
Mean height of 5 students = 140 cm
Then, the total height of 5 students = 140 × 5 = 700 cm
Height of one student = 156 cm
Then, the total height of the remaining 4 students = 700 – 156 = 544
Hence, mean height of the remaining 4 students ![]()
Solution 1(c)
Correct option: (iii) 16 years
Mean age of 8 boys = 16 years
Then, sum of the ages of 8 boys = 16 × 8 = 128 years
Sum of the ages of two more boys = 18 + 14 = 32 years
Now, total age of 10 boys = 128 + 32 = 160 years
Hence, the resulting mean age ![]()
Solution 1(d)
Correct option: (iv) 18
Mean value of 15 numbers = 20
Then, the (incorrect) sum of values of 15 numbers = 20 × 15 = 300
Correct sum = 300 – 45 + 15 = 270
Therefore, correct mean ![]()
Solution 1(e)
Correct option: (iii) ![]()
![]()
Measures of Central Tendency (Mean, Median, Quartiles and Mode) Exercise Ex. 24(B)
Solution 2
|
Age in years C.I. |
xi |
Number of students (fi) |
xifi |
|
16 - 18 |
17 |
2 |
34 |
|
18 - 20 |
19 |
7 |
133 |
|
20 - 22 |
21 |
21 |
441 |
|
22 - 24 |
23 |
17 |
391 |
|
24 - 26 |
25 |
3 |
75 |
|
Total |
50 |
1074 |

Solution 3
(i) Short - cut method
|
Marks |
No. of boys (fi) |
Mid-value xi |
A = 65 di=x-A |
fidi |
|
30 - 40 |
10 |
35 |
-30 |
-300 |
|
40 - 50 |
12 |
45 |
-20 |
-240 |
|
50 - 60 |
14 |
55 |
-10 |
-140 |
|
60 - 70 |
12 |
A = 65 |
0 |
0 |
|
70 - 80 |
9 |
75 |
10 |
90 |
|
80 - 90 |
7 |
85 |
20 |
140 |
|
90 - 100 |
6 |
95 |
30 |
180 |
|
Total |
70 |
|
|
-270 |

(ii) Step - deviation method
|
Marks |
No. of boys (fi) |
Mid-value xi |
A = 65
|
fiui |
|
30 - 40 |
10 |
35 |
-3 |
-30 |
|
40 - 50 |
12 |
45 |
-2 |
-24 |
|
50 - 60 |
14 |
55 |
-1 |
-14 |
|
60 - 70 |
12 |
A = 65 |
0 |
0 |
|
70 - 80 |
9 |
75 |
1 |
9 |
|
80 - 90 |
7 |
85 |
2 |
14 |
|
90 - 100 |
6 |
95 |
3 |
18 |
|
Total |
70 |
|
|
-27 |

Here A = 65 and h = 10

Solution 4
|
C. I. |
Frequency (fi) |
Mid-value xi |
A = 87.50
|
fiui |
|
63 - 70 |
9 |
66.50 |
-3 |
-27 |
|
70 - 77 |
13 |
73.50 |
-2 |
-26 |
|
77 - 84 |
27 |
80.50 |
-1 |
-27 |
|
84 - 91 |
38 |
A = 87.50 |
0 |
0 |
|
91 - 98 |
32 |
94.50 |
1 |
32 |
|
98 - 105 |
16 |
101.50 |
2 |
32 |
|
105 - 112 |
15 |
108.50 |
3 |
45 |
|
Total |
150 |
|
|
29 |

Here A = 87.50 and h = 7

Solution 5
![]()
|
C. I. |
frequency |
Mid-value (xi) |
fixi |
|
0-10 |
8 |
5 |
40 |
|
10-20 |
22 |
15 |
330 |
|
20-30 |
31 |
25 |
775 |
|
30-40 |
f |
35 |
35f |
|
40-50 |
2 |
45 |
90 |
|
Total |
63+f |
|
1235+35f |

Solution 6
|
C.I. |
Frequency |
Mid value x |
fx |
|
15-25 |
10 |
20 |
200 |
|
25-35 |
20 |
30 |
600 |
|
35-45 |
25 |
40 |
1000 |
|
45-55 |
15 |
50 |
750 |
|
55-65 |
5 |
60 |
300 |
|
Total |
75 |
2850 |

Solution 7
|
Class |
Frequency (f) |
Mid Value (x) |
fx |
|
0 - 20 |
7 |
10 |
70 |
|
20 - 40 |
p |
30 |
30p |
|
40 - 60 |
10 |
50 |
500 |
|
60 - 80 |
9 |
70 |
630 |
|
80 - 100 |
13 |
90 |
1170 |
|
Total |
39 + p |
2370 + 30p |

Here mean = 54 ..(ii)
from (i) and (ii)

Solution 8
|
Class |
Freq (f) |
Mid value |
fx |
|
0-20 |
5 |
10 |
50 |
|
20-40 |
f1 |
30 |
30f1 |
|
40-60 |
10 |
50 |
500 |
|
60-80 |
f2 |
70 |
70f2 |
|
80-100 |
7 |
90 |
630 |
|
100-120 |
8 |
110 |
880 |
|
Total |
30+f1+f2 |
2060+30f1+70f2 |
Now,  and
and ![]()
![]()
from (i)
![]()
using (i) and (ii)

Solution 9

Solution 1(a)
Correct option: (i) 41
| C.I. | Class Mark (x) | f | fx |
| 30-40 | 35 | 2 | 70 |
| 40-50 | 45 | 3 | 135 |
|
|
| Σf= 5 | Σfx = 205 |
Alternate Method:
The mean of the set of observations lies between the range of the given data.
Since, the range of observations is from 30 to 50, only option (i), that is, 41 lies between 30 and 50.
Hence, 41 is the mean.
Solution 1(b)
Correct option: (i) 17
Let the assumed mean, A = 15
Class width, I = 10
| C.I. | f | x | u = (x – A)/i | f × u |
| 0-10 | 5 | 5 | –1 | –5 |
| 10-20 | 10 | 15 | 0 | 0 |
| 20-30 | 10 | 25 | 1 | 10 |
|
| Σf = 25 |
|
| Σfu = 5 |
Solution 1(c)
Correct option: () Back answer is 30
| x | f | fx |
| 10 | 10 | 100 |
| 20 | a | 20a |
| 30 | 10 | 300 |
Note: All four values of ‘a’ given in the options satisfy the equation.
In fact, a can take any value apart from this.
Solution 1(d)
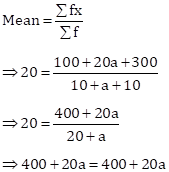
Correct option: (iii) x1 – x2 = 0
| x | f | fx |
| 10 | x1 | 10x1 |
| 20 | 20 | 400 |
| 30 | x2 | 30x2 |
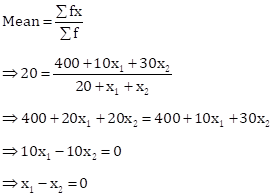
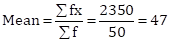
Solution 1(e)
Correct option: (ii) 47
| C.I. | Class Mark (x) | f | fx |
| 40-50 | 45 | 40 | 1800 |
| 50-60 | 55 | 10 | 550 |
|
|
| Σf= 50 | Σfx = 2350 |
Measures of Central Tendency (Mean, Median, Quartiles and Mode) Exercise Ex. 24(C)
Solution 2
Arranging the given data in descending order:
8, 7, 6, 5, 4, 3, 3, 1, 0
The middle term is 4 which is the 5th term.
Median = 4
Solution 3
Arranging the given data in descending order:
28.5, 28, 27.5, 25.5, 24, 24, 22, 21, 21, 20.5
The middle terms are 24 and 24, 5th and 6th terms
![]()
Solution 4
Arranging in ascending order:
22, 24, 25, 26, 26, 27, 27, 28, 28, 29, 21, 32, 32, 33, 35, 35, 36, 36, 37
(i) Middle term is 10th term i.e. 29
Median = 29
(ii) Lower quartile =

(iii) Upper quartile =

(iv) Interquartile range = q3 - q1 =35 - 26 = 9
Solution 5
|
Weight (kg) x |
no. of boys f |
cumulative frequency |
|
37 |
10 |
10 |
|
38 |
14 |
24 |
|
39 |
18 |
42 |
|
40 |
12 |
54 |
|
41 |
6 |
60 |
Number of terms = 60
(i) median = the mean of the 30th and the 31st terms

(ii) lower quartile (Q1) = ![]()
(iii) upper quartile (Q3) = ![]()
(iv) Interquartile range = Q3 - Q1 = 40 - 38 = 2
Solution 6
|
Marks (less than) |
Cumulative frequency |
|
10 |
5 |
|
20 |
24 |
|
30 |
37 |
|
40 |
40 |
|
50 |
42 |
|
60 |
48 |
|
70 |
70 |
|
80 |
77 |
|
90 |
79 |
|
100 |
80 |
Number of terms = 80
\Median = 40th term.
(i) Median = Through 40th term mark draw a line parallel to the x-axis which meets the curve at A. From A, draw a perpendicular to x-axis which meets it at B.
Value of B is the median = 40
(ii) Lower quartile (Q1) = 20th term = 18
(iii) Upper Quartile (Q3) = 60th term = 66
Solution 7
|
Height (in cm) |
No. of pupils |
Cumulative Frequency |
|
121 - 130 |
12 |
12 |
|
131 - 140 |
16 |
28 |
|
141 - 150 |
30 |
58 |
|
151 - 160 |
20 |
78 |
|
161 - 170 |
14 |
92 |
|
171 - 180 |
8 |
100 |
Number of terms = 100

Through 50th term mark draw a line parallel to the x-axis which meets the curve at A. From A, draw a perpendicular to x-axis which meets it at B.
Value of B is the median = 148
 Median height = 148cm
Solution 8
Mode is in 20-30, because in this class there are 20 frequencies.
Solution 9
Mode is in 30-35 because it has the maximum frequency.
Solution 10
Arranging the given data in ascending order:
7, 10, 12, 12, 14, 15, 16, 16, 16, 17, 19
(i) Mode = 16 as it occurs maximum number of times.
(ii) ![]()
(iii)Total marks = 7+10+12+12+14+15+16+16+16+17+19 =
154
(iv) ![]()
Solution 11
|
Score x |
No. of shots f |
fx |
|
0 |
0 |
0 |
|
1 |
3 |
3 |
|
2 |
6 |
12 |
|
3 |
4 |
12 |
|
4 |
7 |
28 |
|
5 |
5 |
25 |
|
Total |
25 |
80 |
(i) Modal score = 4 as it has maximum frequency 7.
(ii) 
(iii) Total score = 80
(iv) ![]()
Solution 1(a)
Correct option: (ii) 18
Arranging data in ascending order,
14, 15, 18, 21, 29
Number of observations, n = 5 (odd)
Then, median = ![]()
Solution 1(b)
Correct option: (iii) 5
Arranging data in ascending order,
0, 2, 3, 4, 6, 8, 11, 16
Number of observations, n = 8 (even)
Then, median = 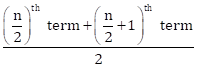
Solution 1(c)
Correct option: (iv) 23
Data arranged in ascending order,
5, 15, 20, x, 28, 30, 35
Number of observations, n = 7 (odd)
Then, median = ![]()
Therefore, x = 23
Solution 1(d)
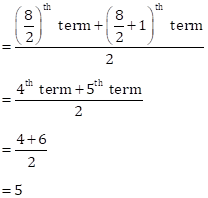
Correct option: (iii) 60 – 20
Data: 10, 20, 30, 40, 50, 60, 70 and 80
Number of observations, n = 8
![]()
![]()
Inter-quartile range = Q3 – Q1 = 60 – 20
Solution 1(e)
Correct option: (iii) 50-60
Modal class is the class with the highest frequency.
Therefore, modal class is 50-60.
