
Class 10 SELINA Solutions Maths Chapter 23 - Graphical Representation (Histograms and Ogives)
Graphical Representation (Histograms and Ogives) Exercise Ex. 23
Solution 2
(i)
|
Class Interval |
Frequency |
|
0-10 |
12 |
|
10-20 |
20 |
|
20-30 |
26 |
|
30-40 |
18 |
|
40-50 |
10 |
|
50-60 |
06 |

Steps of construction:
(a) Taking suitable scales, mark class intervals on x-axis and frequency on y-axis.
(b)Construct rectangles with class intervals as bases and corresponding frequencies as heights.
(ii)
|
Class Interval |
Frequency |
|
10-16 |
15 |
|
16-22 |
23 |
|
22-28 |
30 |
|
28-34 |
20 |
|
34-40 |
16 |

Steps of construction:
(a) Taking suitable scales, mark class intervals on x-axis and frequency on y-axis.
(b) Construct rectangles with class intervals as bases and corresponding frequencies as heights.
(iii)
Since the difference between each class marks is 8, therefore, subtract 8/2 = 4 from each class mark to get the lower limit of the corresponding class interval and add 5 to each class mark to get the upper limit.
|
Class Marks |
Class Intervals |
Frequency |
|
16 |
12-20 |
08 |
|
24 |
20-28 |
12 |
|
32 |
28-36 |
15 |
|
40 |
36-44 |
18 |
|
48 |
44-52 |
25 |
|
56 |
52-60 |
19 |
|
64 |
60-68 |
10 |

Steps of construction:
(a) Convert the class marks into class intervals.
(b) Taking suitable scales, mark class intervals on x-axis and frequency on y-axis.
(c) Construct rectangles with class intervals as bases and corresponding frequencies as heights.
Solution 3
(i)
The cumulative frequency table for the given distribution is as follows:
|
Class Interval |
Frequency |
Cumulative frequency |
|
10-15 |
10 |
10 |
|
15-20 |
15 |
25 |
|
20-25 |
17 |
42 |
|
25-30 |
12 |
54 |
|
30-35 |
10 |
64 |
|
35-40 |
8 |
72 |
Taking upper limits along X-axis and corresponding cumulative frequencies along Y-axis, mark the points (15,10), (20,25), (25,42), (30,54), (35, 64) and (40, 72).
Join the points marked by a free hand curve.

Solution 4
(i)
|
Marks Obtained |
No. of students (c.f.) |
|
less than 10 |
8 |
|
less than 20 |
25 |
|
less than 30 |
38 |
|
less than 40 |
50 |
|
less than 50 |
67 |
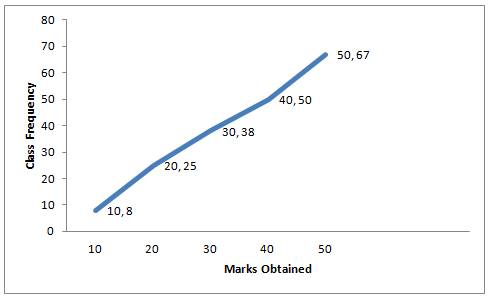
Steps Of construction:
(a) Plot the points (10,8), (20, 25), (30, 38), (40, 50) and (50, 67) on the graph.
(b) Join them with free hand to obtain an ogive.
(ii)
|
Age in years (less than) |
Cumulative Frequency |
|
10 |
0 |
|
20 |
17 |
|
30 |
32 |
|
40 |
37 |
|
50 |
53 |
|
60 |
58 |
|
70 |
65 |
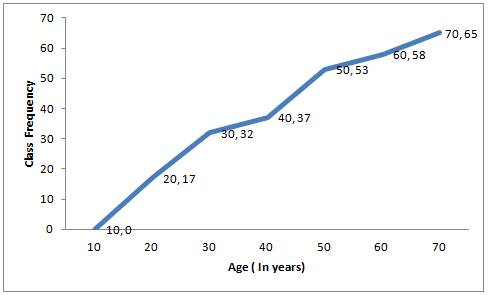
Steps Of construction:
(a) Plot the points (10, 0), (20, 17), (30, 32), (40, 37), (50, 53), (60, 58) and (70, 65) on the graph.
(b) Join them with free hand to obtain an ogive.
Solution 5
(a)
|
Class Interval |
Frequency |
c.f. |
|
8-12 |
9 |
9 |
|
12-16 |
16 |
25 |
|
16-20 |
22 |
47 |
|
20-24 |
18 |
65 |
|
24-28 |
12 |
77 |
|
28-32 |
4 |
81 |
(b) Now plot the points (12, 9), (16, 25), (20, 47), (24, 65), (28, 77), (32, 81) and join them to obtain an ogive.

Solution 6
(i)
|
Wages |
No. Of workers |
c.f. |
|
6500-7000 |
10 |
10 |
|
7000-7500 |
18 |
28 |
|
7500-8000 |
22 |
50 |
|
8000-8500 |
25 |
75 |
|
8500-9000 |
17 |
92 |
|
9000-9500 |
10 |
102 |
|
9500-10000 |
8 |
110 |
Total = 110
(ii)
Now plot the points (7000,10), (7500,28), (8000,50), (8500,75), (9000,92), (9500,102) and (10000,110) and join them to obtain an ogive.

Solution 7
(i)
|
Height (in cm) |
No. Of workers |
c.f. |
|
150-155 |
6 |
6 |
|
155-160 |
12 |
18 |
|
160-165 |
18 |
36 |
|
165-170 |
20 |
56 |
|
170-175 |
13 |
69 |
|
175-180 |
8 |
77 |
|
180-185 |
6 |
83 |
(ii)
We plot the points (155, 6), (160, 18), (165, 36), (170, 56), (175, 69), (180, 77) and (185, 83) on the graph and join them in free hand to obtain an ogive.

Solution 8
(i)
|
Marks (less than) |
Cumulative frequency |
Frequency |
|
0-10 |
7 |
7 |
|
10-20 |
28 |
28-7=21 |
|
20-30 |
54 |
54-28=26 |
|
30-40 |
71 |
71-54=17 |
|
40-50 |
84 |
84-71=13 |
|
50-60 |
105 |
105-84=21 |
|
60-70 |
147 |
147-105=42 |
|
70-80 |
180 |
180-147=33 |
|
80-90 |
196 |
196-180=16 |
|
90-100 |
200 |
200-196=4 |
|
Total |
200 |
(ii)
|
Marks (more than) |
Cumulative frequency |
Frequency |
|
0-10 |
100 |
13 |
|
10-20 |
87 |
22 |
|
20-30 |
65 |
10 |
|
30-40 |
55 |
13 |
|
40-50 |
42 |
6 |
|
50-60 |
36 |
5 |
|
60-70 |
31 |
10 |
|
70-80 |
21 |
3 |
|
80-90 |
18 |
11 |
|
90-100 |
7 |
7 |
|
Total |
100 |
Solution 1(a)
Correct option: (i) a = 16, b = 52 and c = 8
24 + a = 40 ⇒ a = 16
b = 40 + 12 = 52
b + c = 60
52 + c = 60 ⇒ c = 8
Solution 1(b)
Correct option: (ii) 120
Frequency of class 30-50 = 50
Frequency of class 50-70 = 30
Frequency of class 70-90 = 40
Then, cumulative frequency of the class 70-90 = 50 + 30 + 40 = 120
Solution 1(c)
Correct option: (i) ![]()
The adjustment factor is half the difference between the upper limit of the class and the lower limit of the next class.
Note: The adjustment factor is used to convert inclusive classes into exclusive form.
Solution 1(d)
Correct option: (iii) lower limit of 1st class
The cumulative curve for a frequency distribution starts from the lower limit of 1st class.
Solution 1(e)
Correct option: (iv) upper limit of last class
The cumulative curve for a frequency distribution terminates at the upper limit of last class.
