
ICSE Class 10 Answered
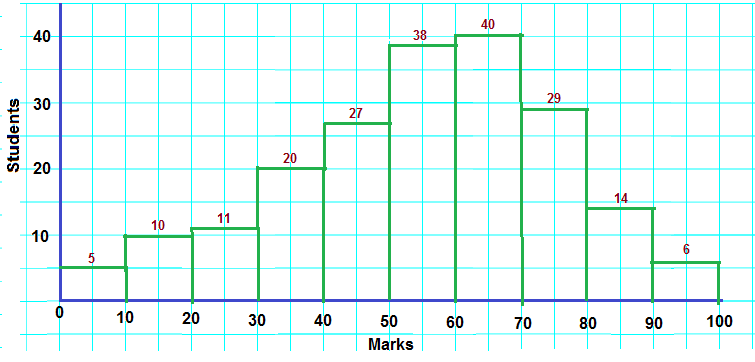
the marks obtained by 200 students in an examination are given below
marks no of students
0-10 5
10-20 10
20-30 11
30-40 20
40-50 27
50-60 38
60-70 40
70-80 29
80-90 14
90-100 6
using draw graph paper draw an ogive
(i)median (ii)lower quartile
(iii)number of students who obtained more than 80% marks in examination
(iv)number of students who failed,if the pass percentage was 45
use scale 2cm==10 marks on one axis and 2cm=20 students on the other axis
Asked by ushanihar12 | 06 Feb, 2019, 10:14: PM
Table showing frequency and cumulative frequency of different class marks is shown below
| Marks | frequency | cumulative frequency |
| 0 - 10 | 5 | 5 |
| 10-20 | 10 | 15 |
| 20-30 | 11 | 26 |
| 30-40 | 20 | 46 |
| 40-50 | 27 | 73 |
| 50-60 | 38 | 111 |
| 60-70 | 40 | 151 |
| 70-80 | 29 | 180 |
| 80-90 | 14 | 194 |
| 90-100 | 6 | 200 |
median = 
whele l is lower limit of median class, h is width of median class, f is frequency of median class,
N is total number of students and C is cumulative frequency preceeding the median class
median = 50 +(10/38)[100 - 73] ≈ 57
lower quartile = 
whele l is lower limit of lower quartile class, h is width of lower quartile class, f is frequency of lower quartile class,
N is total number of students and C is cumulative frequency preceeding the lower quartile class
lower quartile = 40 + (10/27)[ 50 - 46 ]≈ 41.5
Number of students who got marks less than 80 = cumulative frequency of class marks 70-to-80 = 180
Hence number of students who got marks more than 80 = 200 - 180 = 20
Number of students failed, if pass percentage is 45% = cumulative frequency of class marks 30-to-40 = 46
( i assumed all students of 40-to-50 class marks have got 45 marks)
Answered by Thiyagarajan K | 07 Feb, 2019, 12:48: PM
