
ICSE Class 10 Answered
Draw a histogram of the following distribution and estimate its mode:
Profit (in Rs.)
0-10
10-20
20-30
30-40
40-50
50-60
No. of shops
4
8
12
6
4
3
Asked by Topperlearning User | 07 Nov, 2017, 01:22: PM
The Histogram is as follows:
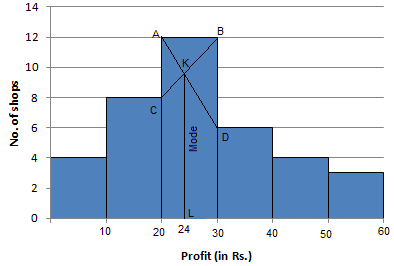
Steps:
i)Mark the upper corner of rectangle with maximum frequency as A and B.
ii)Mark the inner corner of adjacent rectangles to the above rectangle as C and D.
iii)Join AC and BD to intersect at K. From K, draw KL perpendicular to meet X-axis at L.
iv)The value of L on X-axis represents the mode.
Thus, Modal value = Rs. 24
Answered by | 07 Nov, 2017, 03:22: PM
Application Videos
-
Mode of Ungrouped Data
 This video explain the Mode of the discrete data.
 -
Mode of Grouped Data
 This videos explains the concept of Mode of a Continuous Frequency Distribu...
 -
Finding Mode of A Grouped Data

The video explains a question based on finding mode of a grouped data gi...
Concept Videos
-
Mode of Grouped Data ...
 Types of data, Revisit MODE for ungrouped data, calculation of MODE for gr...
 -
Mode of grouped data
 This video explains the types of data, revisits MODE for ungrouped data, de...
 -
Mode Of Grouped Data: Exam Prep Strategies
 Types of data, Revisit MODE for ungrouped data, calculation of MODE for gro...
ICSE 10 - Maths
Asked by Pantkumae861 | 25 Jun, 2019, 08:00: PM
