ICSE Class 10 Answered
Draw a cumulative frequency curve for the following frequency distribution:
C.I.
40-45
45-50
50-55
55-60
60-65
65-70
70-75
75-80
Frequency
5
17
22
45
51
31
20
9
From the ogive, find out lower quartile and upper quartile.
Asked by Topperlearning User | 07 Nov, 2017, 01:12: PM
|
C.I. |
40-45 |
45-50 |
50-55 |
55-60 |
60-65 |
65-70 |
70-75 |
75-80 |
|
Frequency |
5 |
17 |
22 |
45 |
51 |
31 |
20 |
9 |
|
Cumulative Frequency |
5 |
22 |
44 |
89 |
140 |
171 |
191 |
200 |
On a graph paper, plot the points (40,0), (45, 5), (50, 22), (55, 44), (60, 89), (65, 140), (70, 171), (75, 191) and (80, 200) and draw an ogive as shown below:
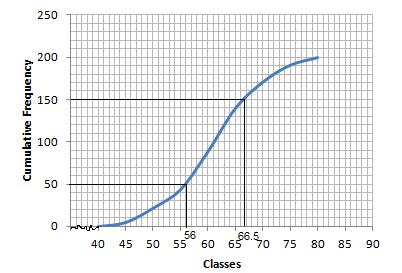
From the ogive, we have
a)Lower Quartile, (Q1) = ![]() = 56
= 56
b)Upper Quartile, (Q3) = ![]() =66.5
=66.5
Answered by | 07 Nov, 2017, 03:12: PM
Application Videos
-
Median of Ungrouped Data
 Method of finding Median of the given data, when the numbers the number of ...
 -
Median of Grouped Data
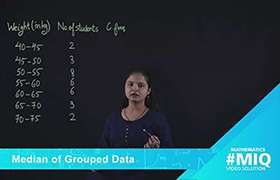
This videos explains the concept of Mean of a Continuous Frequency Distr...
-
Median of Grouped data

The video explains that how to find the median of grouped data
-
Cumulative Frequency Curve

The video explains an example based on Cumulative Frequency Curve.
Concept Videos
-
About median of grouped data
 This video is based on median of grouped data.
 -
More concepts related to median of grouped data
 This video discussed about median of grouped data and helps visualising the...
 -
Median of grouped data
 This video explains how to find median of grouped data and solves some exam...