
CBSE Class 9 - Grouping and Tabulation of Data Videos
Grouping and Tabulation of Data
Meaning, origin & development of statistics, types of statistical data. Presenting data in form of frequency distribution.
More videos from this chapter
View All-
Grouping and Tabulation of Data
-
...
-
Grouping and Tabulation of Data

-
Cumulative Frequency of a particular class-interval ...
-
Cumulative Frequency of a particular class-interval ...
- what is class mark?
- Following are the marks obtained by 20 students in an class 9 examination , 12,8,18,16,1,6,8,5,23,12,16,23,10,2,12,20,7,9,0,5 present the data in the form of a frequency distribution using (the class size such as 0-5 ,5-10 etc , how many students obtained marks below 15
- The blood groups of 30 students are recorded as follows : A, B, O, A, AB, O, A, O, B, A, O, B, A, AB, B, A, AB, B, A, A, O, A, AB, B, A, O, B, A, B, A Prepare a frequency distribution table for the data.
- The relative humidity in Delhi, for the month of July, this year as reported by the Meteorological Department is given below : 90, 97, 92, 95, 93, 95, 93, 85, 83, 85, 83, 77, 83, 77, 74, 60, 71, 65, 80, 87, 82, 81, 76, 61, 63, 58, 58, 56, 57, 54, 98 Present the data in the form of frequency distribution.
-
The value of
 upto 50 decimal places is given below:
3.14159265358979323846264338327950288
(i) Make a frequency distribution of the digits from 0 to 9 after the decimal point.
(ii) What are the most and the least appearing digits?
upto 50 decimal places is given below:
3.14159265358979323846264338327950288
(i) Make a frequency distribution of the digits from 0 to 9 after the decimal point.
(ii) What are the most and the least appearing digits?
- Given below are the marks obtained by 50 students of class IX in a test of Hindi. 42, 21, 51, 37, 42, 37, 38, 42, 49, 52, 38, 53, 57, 47, 29, 59, 61, 33, 17, 71, 39, 43, 42, 39, 14, 7, 27, 19, 54, 51, 39, 43, 42, 16, 37, 67, 62, 39, 51, 53, 41, 53, 59, 37, 27, 33, 34, 42, 22, 31. With these data, form a less than type cumulative frequency table.(i) What is the range of marks. (ii) What can you conclude from the above data about the number of students who scored more than 35.
-
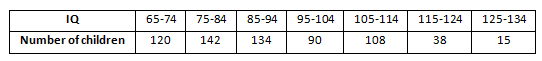
The following data shows IQs of some children. Represent it using the continuous frequency distribution.
- The following is the data of 20 students' average marks in all subjects: 36 39 40 48 53 52 50 51 43 40 33 49 54 47 45 52 45 44 32 53 Form a grouped discontinuous frequency distribution table such that one of the classes is 46-50.
- The blood groups of 30 donors in a blood donation camp are recorded as follows:A, B, O, O, AB, O, A, O, B, A, O, B, A, O, O,A, AB, O, A, A, O, O, AB, B, A, O, B, A, B, O.Represent this data in the form of a frequency distribution table. Which is the most common and which is the rarest blood group among these donors?
- The distance, in km, from school to homes of thirty children is listed below: 16, 2, 3, 5, 12, 5, 8, 4, 8, 10, 3, 4, 12, 2, 8, 15, 1, 17, 6, 3, 2, 8, 5, 9, 6, 8, 7, 14, 12, 11. (i) Make a grouped frequency distribution table for this data, taking class width 5and one of the class intervals as 5 - 10. (ii) How many children live at a distance of more than 15 km from school?
